vllm-vcr
GPU-free vLLM engine-core replay
Record a real vLLM engine once, then replay its protocol behavior, timing, and optional output tokens behind the real vLLM frontend on ordinary CPU hosts.
vllm-vcr is a single binary with three subcommands:
recordtaps a live vLLM frontend ↔ engine-core link as a transparent ZMQ proxy and writes a JSONL trace.playruns a mock engine-core backend that speaks the real ZMQ + msgpack protocol. It can generate synthetic tokens, sample timing from a fitted trace, replay recorded step timing, or serve recorded token ids.inspectconverts benchmark reports, summarizes traces, renders Perfetto timelines, and runs calibration checks.
With the optional nixl feature and a working libnixl/UCX runtime, play can also
move simulated KV-cache bytes between prefill and decode instances over NIXL.
What it is for
Testing the software around a vLLM engine usually means provisioning GPUs and model
weights before you can exercise frontends, cache-aware routers, schedulers,
autoscalers, or CI compatibility matrices. vllm-vcr keeps the real frontend and
wire protocol in the loop, but replaces the model backend with a CPU simulator.
Use it when you need to:
- replay captured TTFT and inter-token behavior without a GPU;
- run OpenAI-compatible frontend, streaming, LoRA, scheduler, and router tests against the real engine-core protocol;
- validate trace fidelity and version compatibility in CI;
- test prefill/decode control-plane behavior, and optionally the NIXL data plane, without model weights.
It is not a model-quality simulator: generated tokens are random unless you record and replay token ids, and latency fidelity depends on traces captured from the engine/configuration you care about.
How it fits
The vLLM frontend remains responsible for tokenization, chat templates, tool calling,
streaming, metrics, and OpenAI-compatible HTTP handling. vllm-vcr play only replaces
the engine-core process behind that frontend. For prefill/decode work, the default
data plane is a no-op; the NIXL path is opt-in and still runs without CUDA or model
weights.
New setup
Read Architecture, then install the binary and run the quick start.
Trace replay
Start with Trace replay and calibration for capture, model fit, and replay modes.
Operations
Use Versioning and Conformance for multi-line vLLM support.
Architecture
vllm-vcr sits at the engine-core boundary. The frontend is still a normal vLLM
frontend; the simulator connects where a headless engine would connect and speaks the
same ZMQ + msgpack protocol. The protocol types come from vLLM's in-tree
vllm-engine-core-client crate, pinned per supported vLLM line.
The main pieces are:
connect_to_frontendjoins the frontend-owned handshake, reports ready, and opens the DEALER/PUSH data sockets.src/io.rsdecodes incoming frames intoEngineInputand writesEngineOutputmessages back to the frontend.src/engine.rsowns scheduling, latency, token emission, LoRA accounting, prefix-cache state, and failure injection.src/dataplane.rsis the prefill/decode integration point. Prefill advertises KV metadata throughkv_transfer_params; decode pulls those blocks. The defaultNoopDataPlaneonly exercises the control plane, whileNixlDataPlaneperforms real NIXL reads when thenixlfeature is enabled.
record uses the same boundary in proxy form: it presents as an engine to the
frontend, presents as a frontend to the real engine, relays frames unchanged, and
records timing/token metadata from decoded copies.
Status
vllm-vcr is usable today for protocol-level frontend testing, trace replay,
calibration, and GPU-free prefill/decode control-plane experiments. The NIXL data
plane is implemented behind an optional feature and needs a Linux host with libnixl
and UCX.
| Area | State | Validation |
|---|---|---|
| Engine-core protocol | Streaming and non-streaming OpenAI flows work through the vLLM Rust frontend over ZMQ/msgpack, with tokenizer, detokenizer, chat template, and frontend metrics intact. | ./scripts/e2e.sh |
| Trace timing | TTFT, inter-token gaps, multi-token chunks, prefix-cache structure, and arrival/session pacing can be captured, modeled, and replayed. | inspect calibrate, inspect calibrate-e2e, trace replay tests |
| Content replay | record --record-tokens plus play --replay-tokens can serve recorded token ids and finish reasons. | tests/engine_core_e2e.rs, tests/closed_loop_prefix_replay.rs |
| P/D control plane | The simulator produces and consumes vLLM NixlConnector kv_transfer_params per request. | scripts/pd_control.sh |
| NIXL data plane | Prefill registers a paged KV pool and serves metadata; decode fetches metadata and posts paged NIXL reads. | tests/nixl_loopback.rs on Linux + libnixl |
| Multi-version support | The build matrix pins one vllm-engine-core-client rev per supported line and uses conformance goldens when available. | CI matrix + tests/conformance.rs |
If NIXL initialization fails at runtime, the engine logs a warning and falls back to
NoopDataPlane, so protocol tests can still run.
./scripts/pd_control.sh              # macOS: control-plane schema round trip
cargo check --features nixl-stub     # macOS gate: typecheck the NIXL path
cargo test  --features nixl          # Linux: NIXL transfer
Install
vllm-vcr requires Rust 1.85 or newer. The default build is pure Rust and does not
include NIXL.
From a checkout:
cargo install --path . --locked
That installs the single vllm-vcr binary with record, play, inspect, and
completions subcommands.
To install the default no-NIXL build directly from Git:
cargo install --git https://github.com/neuralmagic/vllm-vcr \
  --locked vllm-vcr
For a NIXL-enabled binary, build on Linux with libnixl and UCX available:
cargo install --path . --locked --features nixl
For local development on a machine without libnixl, use the stub feature to typecheck the NIXL code path without enabling real transfers:
cargo check --features nixl-stub
For Kubernetes deployments, build the container image instead. The image includes the vLLM Rust frontend, the simulator, libnixl, and UCX:
podman build -t ghcr.io/neuralmagic/vllm-vcr:dev .
Quick start
This smoke test runs the real vLLM frontend and replaces only the engine-core backend. It does not need a GPU or model weights, but the frontend still downloads the tokenizer on first use.
Start the simulator:
vllm-vcr play --handshake-address tcp://127.0.0.1:29550 --log-requests
In another shell, start a vLLM frontend with the same handshake port and no local
engine rank. The exact command depends on the vLLM line and frontend you are testing;
vllm-vcr uses the same external-engine role as vLLM's mock-engine harness. The repo
script wraps the common Rust-frontend path:
./scripts/e2e.sh
Send a streaming chat request once the frontend is up:
curl http://127.0.0.1:8000/v1/chat/completions \
  -H 'Content-Type: application/json' \
  -d '{"model":"Qwen/Qwen3-0.6B","messages":[{"role":"user","content":"hello"}],"max_tokens":16,"stream":true}'
Prefill/decode control-plane smoke
Run the routing-sidecar schema round trip without NIXL:
./scripts/pd_control.sh
For the Kubernetes P/D deployment, build the image from the install section and use deploy/llm-d-pd/README.md.
Replay a trace
Once you have a tap trace, use it as the latency source:
vllm-vcr play --handshake-address tcp://127.0.0.1:29550 \
  --latency-trace trace.jsonl.gz --log-requests
If the trace was captured with record --record-tokens, add
--replay-tokens trace.jsonl.gz to serve the recorded token ids instead of random
tokens.
Verifying release artifacts
Every GitHub Release tarball ships with four supply-chain artifacts:
*.sha256— a plain checksum, no tooling required (shasum -a 256 -c <file>.sha256).*.cdx.json— a CycloneDX SBOM of the build's dependency graph.*.sig+*.pem— a cosign keyless signature and its Fulcio certificate, for offline verification.- a SLSA build provenance attestation recorded in GitHub, binding the tarball's digest to the workflow run that produced it.
Verify provenance (proves it was built by this repo's release workflow):
gh attestation verify vllm-vcr-vllm0.23-x86_64-unknown-linux-musl.tar.gz \
  --repo neuralmagic/vllm-vcr
Verify the cosign signature without GitHub:
cosign verify-blob \
  --certificate vllm-vcr-vllm0.23-x86_64-unknown-linux-musl.tar.gz.pem \
  --signature  vllm-vcr-vllm0.23-x86_64-unknown-linux-musl.tar.gz.sig \
  --certificate-identity-regexp '^https://github.com/neuralmagic/vllm-vcr/' \
  --certificate-oidc-issuer https://token.actions.githubusercontent.com \
  vllm-vcr-vllm0.23-x86_64-unknown-linux-musl.tar.gz
Shell completions
vllm-vcr completions <shell> prints a completion script to stdout for bash,
zsh, fish, powershell, or elvish. Install it wherever your shell loads
completions, for example:
# fish
vllm-vcr completions fish > ~/.config/fish/completions/vllm-vcr.fish

# bash (current shell)
source <(vllm-vcr completions bash)

# zsh (into a directory on $fpath)
vllm-vcr completions zsh > ~/.zfunc/_vllm-vcr
The script is generated from the live command tree, so it always matches the subcommands and flags of the binary you ran it from.
Testing
The main local gate is:
cargo fmt --all --check
cargo clippy --workspace --all-targets --locked --no-deps -- -D warnings
cargo test --workspace --locked
The full smoke scripts also boot a real vLLM frontend:
./scripts/e2e.sh        # boots vllm-rs + this engine, asserts streaming + non-streaming flows
./scripts/e2e_lora.sh   # loads a LoRA adapter, asserts vllm:lora_requests_info names it
./scripts/e2e_generate.sh # exercises /inference/v1/generate token-in/token-out
These scripts need vllm-rs built once (cargo build --bin vllm-rs in the vLLM
rust/ workspace). Override its path with FRONTEND_BIN=.... The first run fetches
the tokenizer from Hugging Face.
e2e_lora.sh needs a frontend that exports vllm:lora_requests_info from the
frontend metrics path. The image and current default protocol pin qualify; if you use
your own checkout, point FRONTEND_BIN at a compatible build.
LoRA simulation
The simulator tracks LoRA adapters loaded by the frontend through the engine utility
path (add_lora / remove_lora) and uses that registry while scheduling requests.
--max-loras mirrors vLLM's running-batch diversity cap: it limits how many distinct
adapters may be resident in the running batch at once. 0 disables the cap, but LoRA
accounting still runs so frontend metrics can report running and waiting adapters.
In the container image, set MOCK_MAX_LORAS; the entrypoint maps it to
vllm-vcr play --max-loras.
The vllm:lora_requests_info metric is frontend-derived on current supported vLLM
lines. The simulator's job is to keep scheduler stats and adapter state consistent
enough for that frontend metric to reflect the request mix.
NIXL data plane
The NIXL path is optional. It needs libnixl and UCX on Linux, using either RDMA
NICs or shared-memory transports. On a development machine without that runtime,
typecheck the code path against stubs:
cargo check --features nixl-stub
On Linux with NIXL installed, split a prefill and a decode engine:
# prefill
cargo run --features nixl -- play --pd-role prefill \
  --engine-id mock-prefill --side-channel-host 127.0.0.1 --side-channel-port 5600 ...

# decode
cargo run --features nixl -- play --pd-role decode \
  --engine-id mock-decode --side-channel-port 5601 ...
The transfer path uses remote_host and remote_port from kv_transfer_params to
fetch the prefill's PoolDescriptor over a TCP metadata side channel, then issues
NIXL READs for the advertised block ids. Decode receives those remote_* fields per
request; the prefill address is not a decode CLI argument.
tests/nixl_loopback.rs validates the byte-transfer path with distinct prefill and
decode agents in one process. Kubernetes deployment validation is separate.
Engine internals
The engine separates loop orchestration from request behavior.
EngineCore (src/engine_core.rs) is the top-level contract. The generic
run_loop owns the tokio select! over inputs, internal events, and deadline
ticks. Any struct implementing EngineCore can use the loop. SimEngine is the
production implementation; ConstantEngine (test-only, same file) is a minimal
engine used by loop tests.
Three strategy traits on SimEngine control request behavior:
| Trait | File | Default | What it controls |
|---|---|---|---|
TokenSource | src/tokens.rs | RandomTokens | Which token ids each request emits. EchoTokens replays the prompt. |
LatencyModel | crates/sim-trace/src/latency.rs | KnobLatency | TTFT and inter-token pacing. FixedLatency gives constant delays with no rng draws. |
Scheduler | src/sched.rs | Fcfs | Waiting-queue admission order. Priority uses (priority, arrival_time). ShortestPromptFirst picks the smallest prompt. |
Defaults are wired in SimEngine::new (from CLI flags) and in run().
Contract tests live in tests/engine_core_e2e.rs. They drive ZMQ, protocol
framing, and channels, then assert wire-level behavior. Unit tests in
src/engine.rs cover engine internals.
Trace replay and calibration
Trace replay has two separate axes:
- Workload replay: recorded arrivals, sessions, prompt prefix structure, and optionally output token ids.
- Timing replay: either sampled from a fitted latency model, replayed verbatim from recorded step gaps, or replaced with explicit timing knobs.
Keeping those axes separate is important. You can replay a captured workload while testing a latency model fit from a different capture, or you can serve the same recorded token stream with synthetic timing for fast client tests.
The trace files used to build the committed figures live under traces/, which is
gitignored. See
traces/README.md
for the local inventory and which captures are fitting inputs versus gate seeds.
Start with Concepts for terminology, then use the scenario pages for arrival replay, prefix-cache workloads, content-identical replay, and multi-token step replay.
Concepts
The trace docs use three terms consistently:
- Captured — per-token tap recordings from a vLLM engine, taken server-side on the engine-core protocol. Figures label these as "real" or "source".
- Modeled — latency the simulator emits. TTFT and per-token gaps are drawn from a statistical model fitted to a captured trace (conditioned on concurrency, context depth, and uncached prompt size). Captured timings are not played back verbatim, so a model fitted on one workload can be evaluated on another.
- Direct replay — recorded values used verbatim, no statistics: arrival
timestamps (
--replay-arrivals), session pacing (--replay-sessions), prefix structure (block hashes), per-step gaps (--replay-steps), and opt-in output token ids (--replay-tokens).
"Replay" in a figure or flag name refers to the workload side (the schedule being replayed), not to the timing. Counterfactual gates fit on workload A, directly replay workload B's schedule, and check the modeled timing against B's capture.
just figures rebuilds the figures from local trace files listed in
traces/README.md (scripts/make_figures.sh; ~30 minutes, the
arrival replays run in real time). Those trace files are not committed. The
head-to-head comparison is the exception; it needs live serving stacks (commands in
that section).
Calibration demo
The vllm-vcr inspect subcommands include a calibration harness for quick local
checks. The synthetic demo trace is deliberately heavy-tailed, so it shows the
difference between the trace-fitted model and simple mean/std-dev knobs.
The harness checks two properties:
TraceLatencyreplay reproduces source-trace quantiles within tolerance.KnobLatencycannot reproduce heavy tails: its[0.3*mean, 1.7*mean]clamp caps p99/p50 at roughly 1.7x for any knob settings.
This model-level check applies to ITL and to TTFT on unloaded traces. On loaded captures, the TTFT marginal comes from queueing and chunk interference rather than a sampled distribution, so this check can fail by design. Loaded TTFT is checked by the arrival-replay scenarios below.
# 1. Generate a synthetic heavy-tailed trace (lognormal TTFT/ITL).
cargo run --bin vllm-vcr -- inspect gen-demo -o /tmp/demo.jsonl

# 2. Model-level calibration (no transport).
cargo run --bin vllm-vcr -- inspect calibrate /tmp/demo.jsonl

# 3. Wire-level: start the simulator and measure client-side.
cargo run --bin vllm-vcr -- inspect calibrate-e2e /tmp/demo.jsonl --requests 60
--fast on gen-demo produces a small-magnitude trace for quick e2e testing
(TTFT ~15-40ms, ITL ~3-10ms). All subcommands accept --json for machine-readable
output and --seed for determinism.
Calibration with engine captures
The recording tap (vllm-vcr record, deployment manifests in
deploy/trace-capture/) sits between the
vLLM Rust frontend and a headless vLLM engine (Qwen3-8B, TP=1, H200), recording
per-token inter-token gaps server-side over in-pod localhost ZMQ.
This page explains the figures used to validate the trace-fitted latency model. The important point: the model is not replaying a single request's gaps. It samples from captured observations conditioned on request shape and concurrency, so it can be tested out of sample.
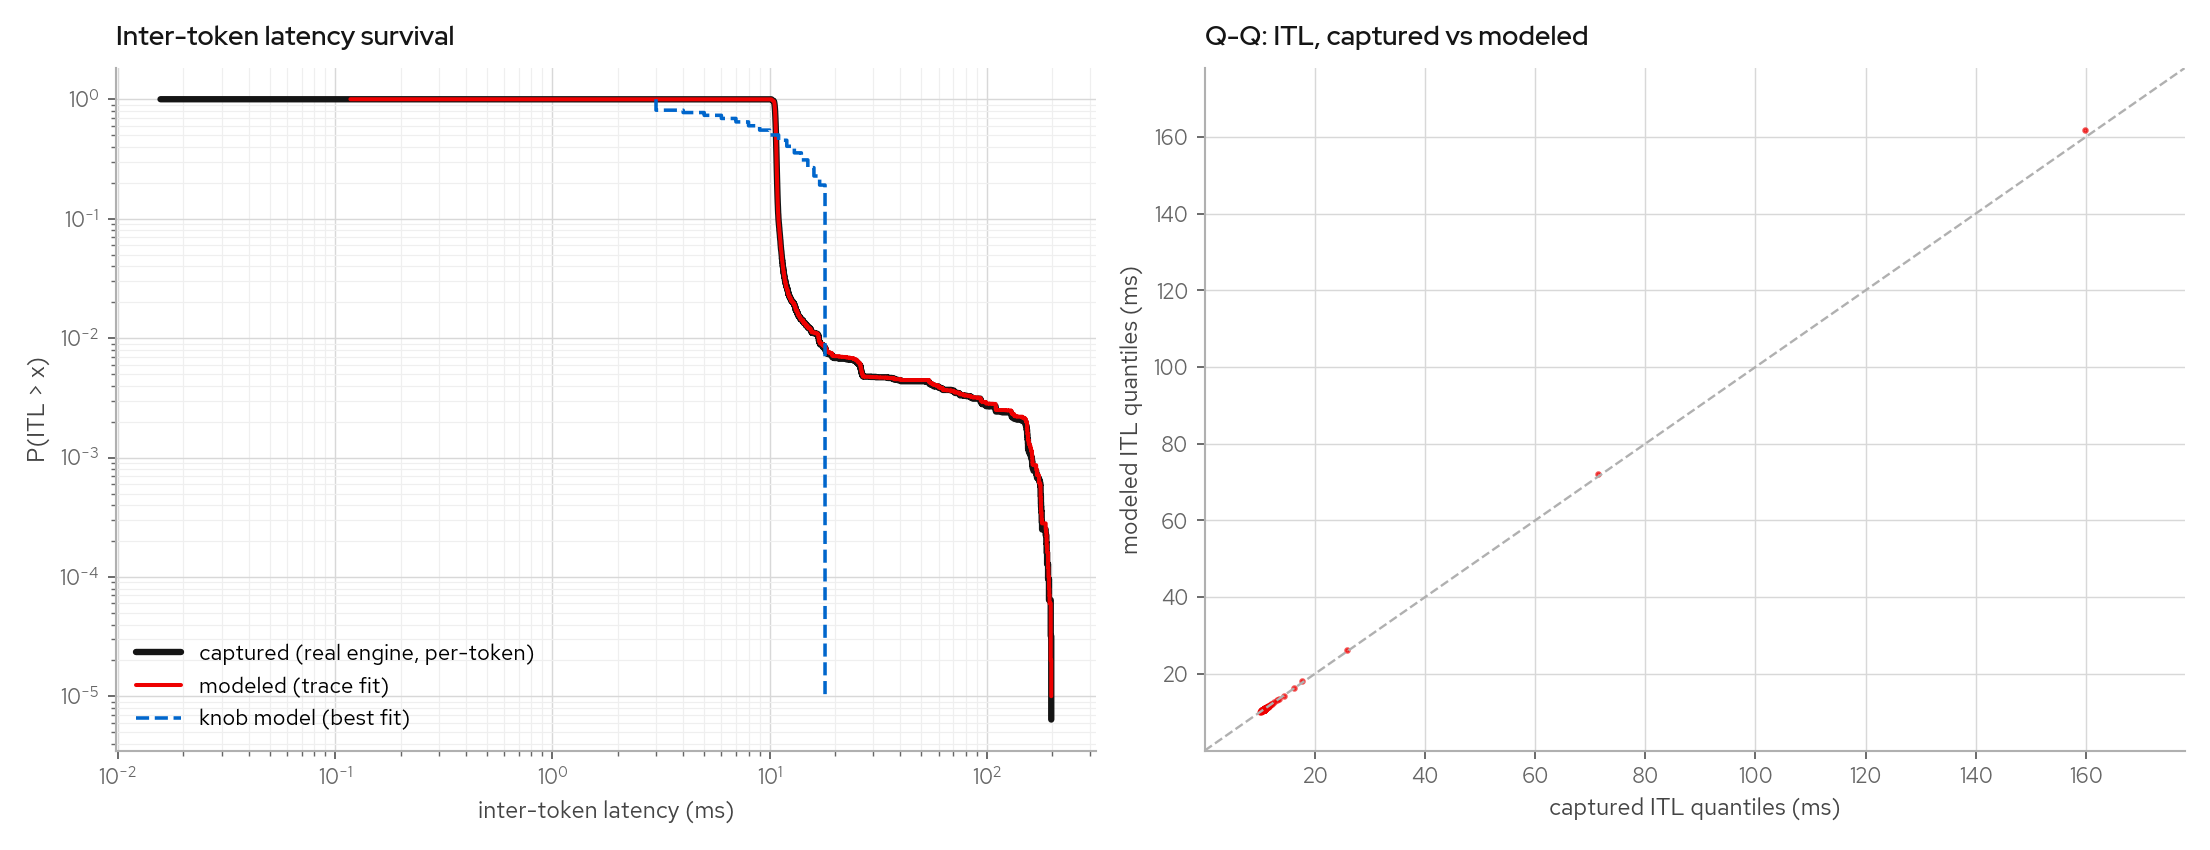
The figures below plot captured vs TraceLatency vs best-fit KnobLatency per-token
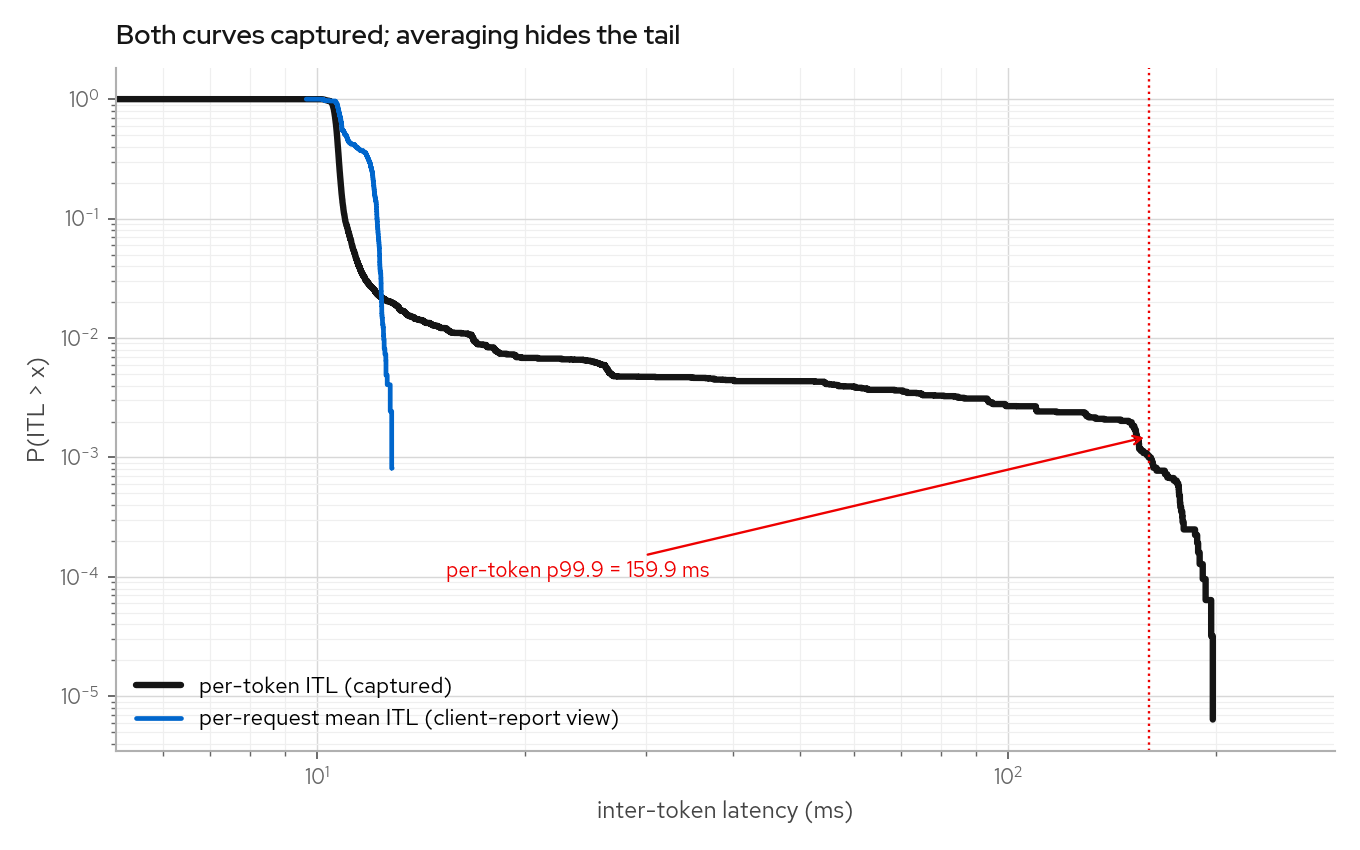
ITL (survival curve and Q-Q plot), and the same trace as pooled per-token ITLs vs
per-request mean ITLs. Client-side benchmark reports such as guidellm usually expose
per-request means because they record first/last token timestamps. The knob model's
[0.3*mean, 1.7*mean] clamp appears as a vertical cutoff before the captured tail.
To regenerate from any trace with per-token itl_ms arrays:
cargo run --bin vllm-vcr -- inspect calibrate trace.jsonl --dump-samples samples.json
uv run scripts/plot_calibration.py --samples samples.json --trace trace.jsonl --out-dir docs/images
Comparison with llm-d-inference-sim
Same workload (deploy/trace-capture/loadgen.py, concurrency 1 and 16, 512/128
tokens) against three targets: the H200 engine (tap-recorded), this simulator with its
latency model fit from the canonical fitting set (a different workload, the
counterfactual setting), and the Go
llm-d-inference-sim (v0.9.1) with its
latency knobs fit to the same trace (the in-sample setting). Both simulators ran on the
same host and were measured client-side by the same load generator. The engine curves
are the tap recording. Both simulators' timing is modeled.
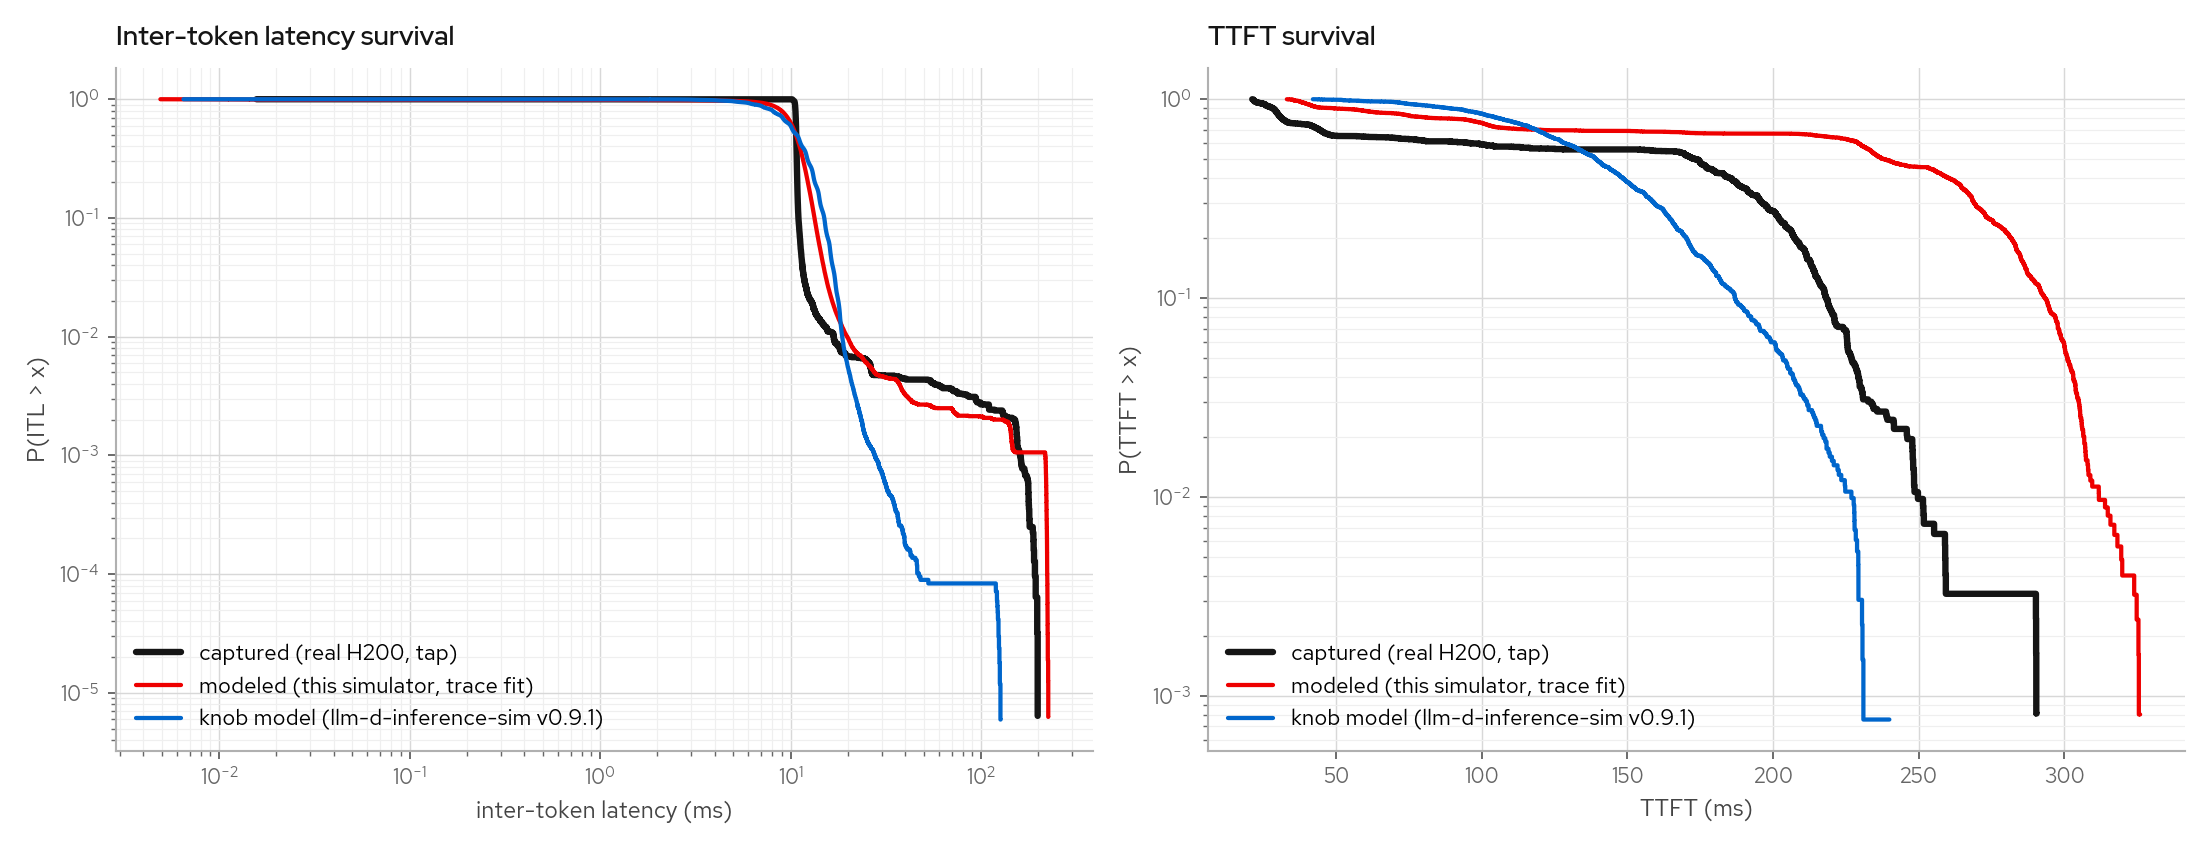
The step model over-predicts TTFT for this saturated fixed-concurrency workload by about 70ms at the median, a known calibration gap in the out-of-sample fit. The knob model clamps both tails by construction.
Note: the trace's std-devs (TTFT 80ms, ITL 8ms) exceed llm-d-inference-sim's config validation, which caps std-dev at 30% of the mean, so it runs with the largest spread it accepts (39ms / 3.3ms).
# llm-d-inference-sim invocation used above
llm-d-inference-sim --port 8001 --model Qwen/Qwen3-8B --mode random \
  --force-dummy-tokenizer --max-model-len 16384 --max-num-seqs 128 \
  --time-to-first-token 132ms --time-to-first-token-std-dev 39ms \
  --inter-token-latency 11ms --inter-token-latency-std-dev 3300us

# this simulator: vllm-rs frontend + trace-fitted model, vLLM-default scheduler
# limits; the fit is the canonical set (sweep + warm multiturn + cold multiturn)
cat traces/h200-qwen3-8b/h200-sweep-full.jsonl \
    <(grep -v '"meta"' traces/h200-qwen3-8b/h200-multiturn-mtfit2.jsonl) \
    <(grep -v '"meta"' traces/h200-qwen3-8b/h200-multiturn-nocache4.jsonl) > /tmp/fit.jsonl
vllm-vcr play --handshake-address tcp://127.0.0.1:5571 \
  --latency-trace /tmp/fit.jsonl \
  --max-num-seqs 1024 --max-num-batched-tokens 8192
Step-granular interference
The engine paces emission with a step clock that mirrors vLLM's per-step schedule: decodes claim the shared token budget first, prefills chunk into whatever remains (in admission order), and every co-running decode's gap is the composed step's duration. Chunk compute is fitted from the trace as a depth-dependent function (attention makes deep chunks cost more per token) plus a max-shape premium for budget-saturated steps; small chunks hide under the batch's decode compute. Queueing, chunk serialization, and decode elongation are produced by the step composer rather than by interference knobs.
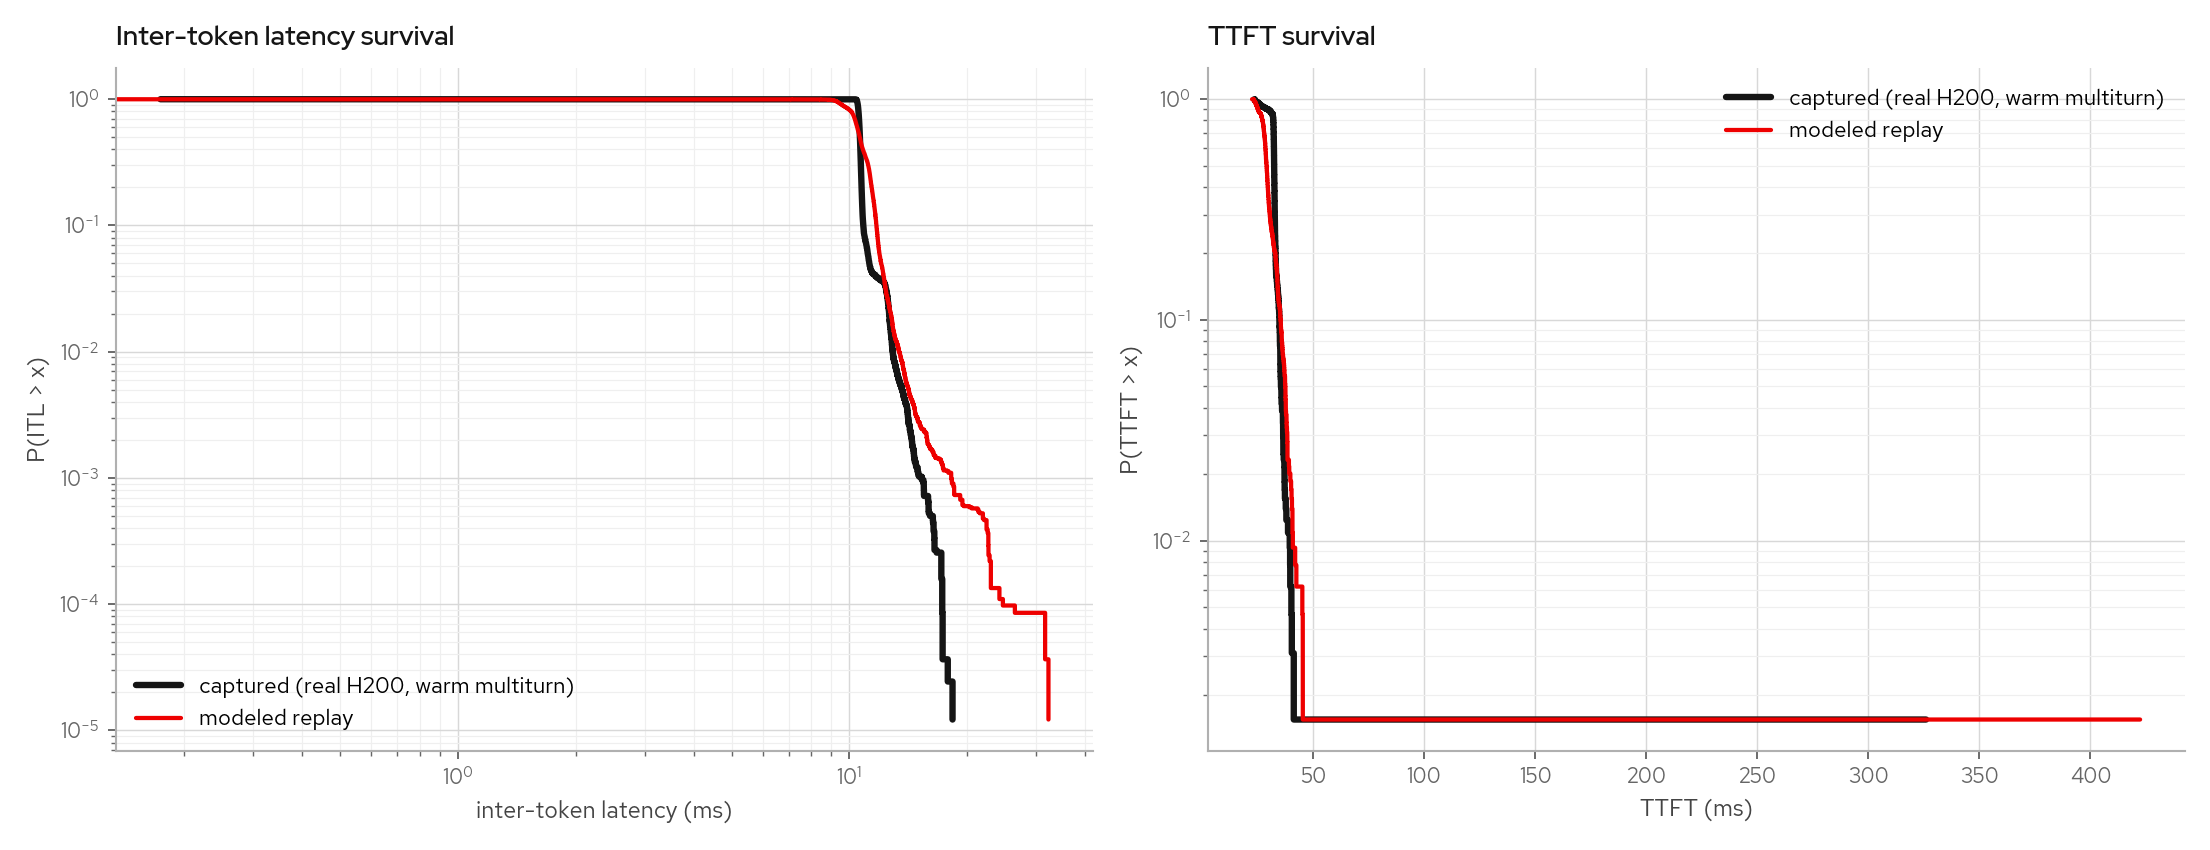
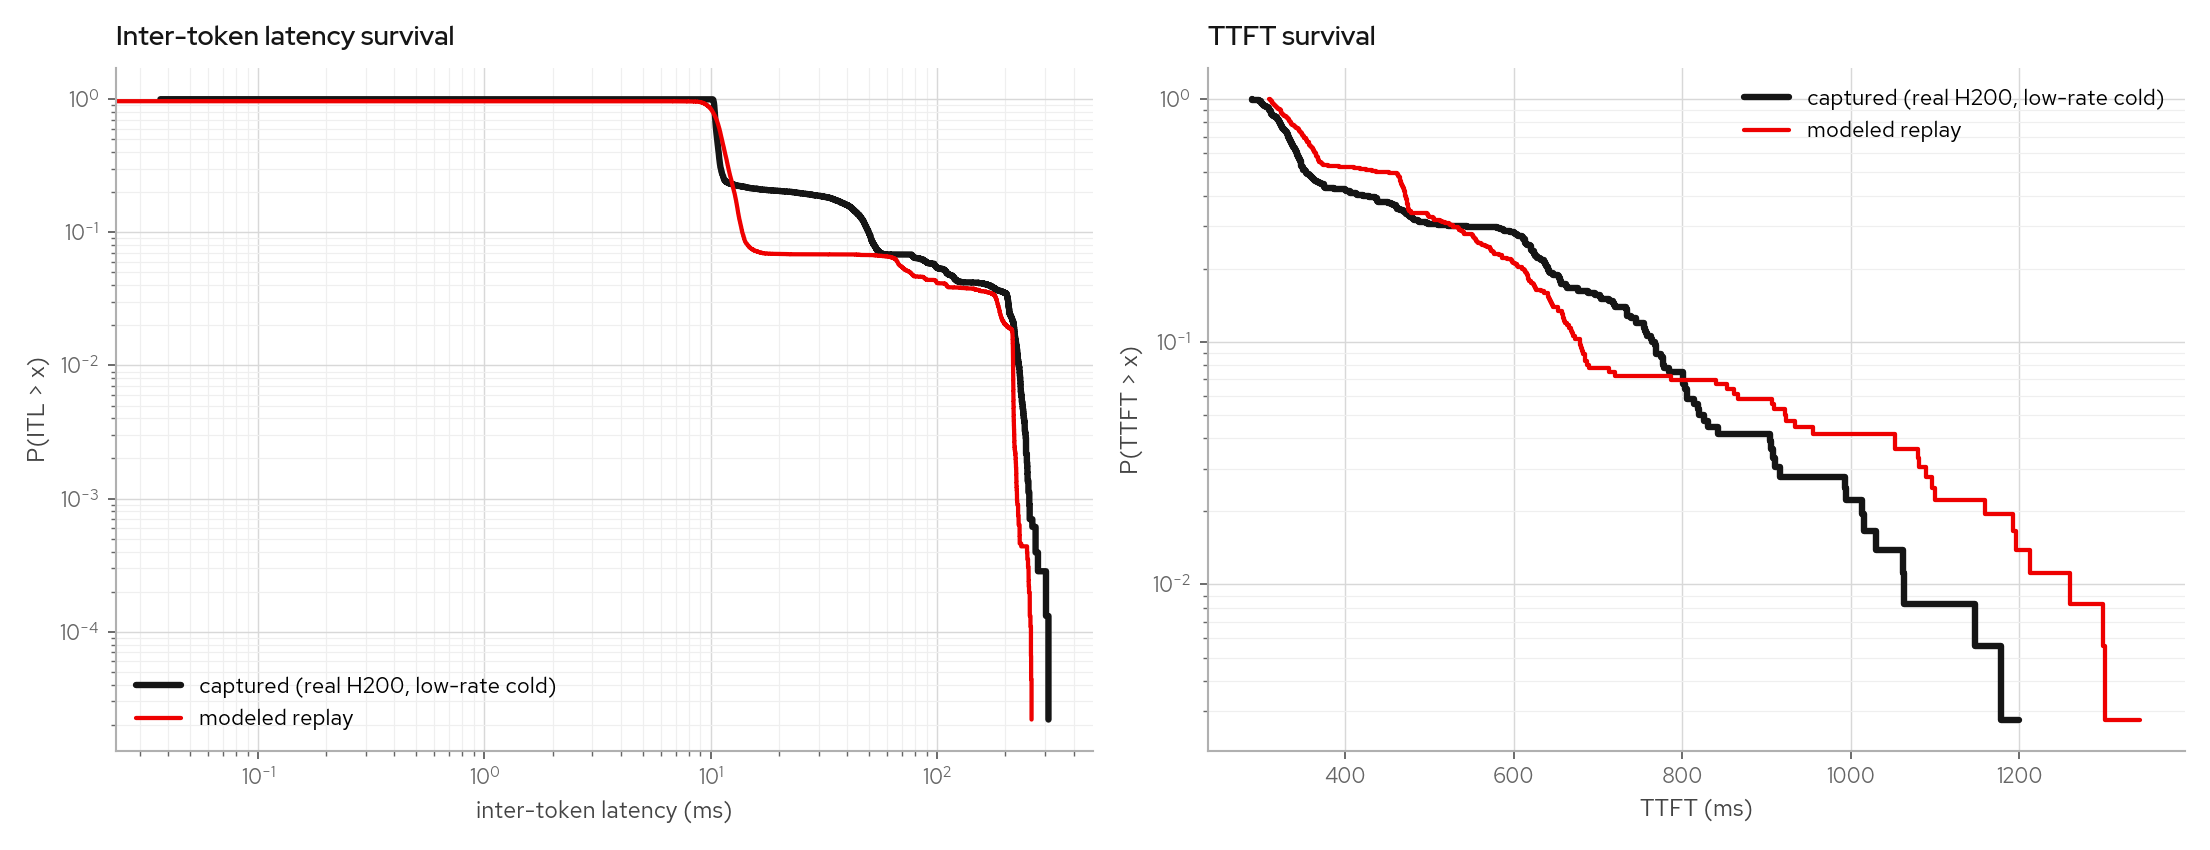
The gate is counterfactual: fit on one workload (a constant-load sweep plus a warm multiturn capture), then predict a cold-cache multiturn (~11k-token prompts, prefix caching disabled) the model never saw, whose prefill chunks continuously interfere with running decodes. The capture shows a two-shelf ITL band; the replay reproduces the band's shape, mass (13.9% vs 14.1%), and tail.
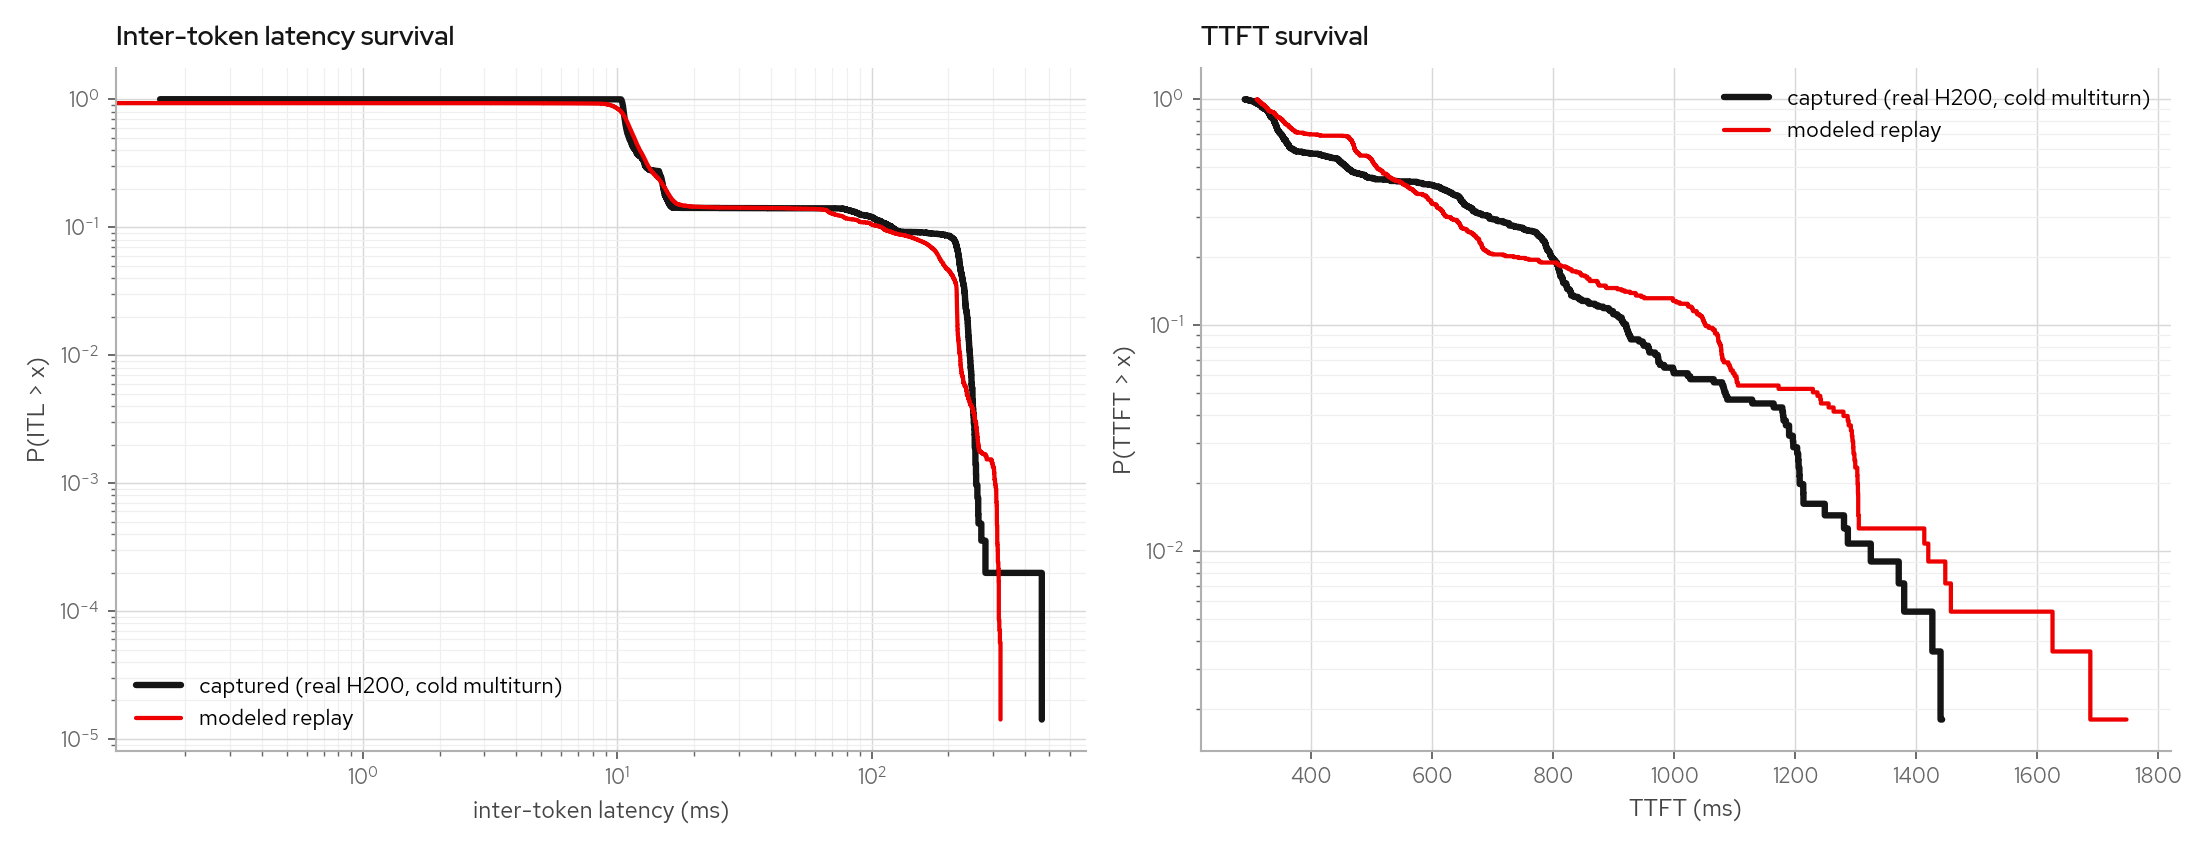
The warm-multiturn factual leg (99%+ prefix-cache hits) and a low-rate cold leg stay calibrated under the same model:
The same fit procedure refits from a Qwen3-30B-A3B MoE sweep without constant changes and reproduces its counterfactual band.
Open-loop arrival replay
The calibrations above sample the latency model closed-loop. That validates
distributions, but it does not cover TTFT queueing, prefill stalls, or concurrency
mixing from an external arrival process.
calibrate-e2e --replay-arrivals direct-replays a captured arrival schedule in real
time (each request sent at its recorded offset, open loop) and compares client-side
TTFT/ITL/request-total quantiles against the capture. The arrivals are verbatim; every
latency is still modeled. --latency-trace fits the sim's model from a different
trace, so the gate runs on an arrival process outside the fitting set.
Setup: use the same frontend → tap → engine stack as the capture rig, then run the
replay locally with vllm-vcr play as the engine. The latency model is fit from the
canonical H200 fitting set, while deploy/trace-capture/loadgen.py --pattern poisson|burst drives arrival processes the fitting set never contained.
| scenario | requests | concurrency seen | TTFT max err | ITL max err | req-total err |
|---|---|---|---|---|---|
| poisson, 4 req/s | 464 | 1-15, median 6 | 36.1%* | 1.1% | 0.2% |
| burst, 24 per 10s | 288 | 0 -> 24 spikes | 0.4% | 0.05% | 0.5% |
| multiturn agentic (see below) | 495 | 1-13 | 26.0%* | 0.9% | 2.5% |
The max-err columns are the worst single quantile across all concurrency buckets. The starred cells are small-n tail artifacts: poisson's worst cell is its n=2 concurrency-1 bucket, multiturn's is a warm-TTFT p99 where captured 103ms vs modeled 76ms differ by transport jitter the in-process replay does not model. Medians and p90s agree within ~1-2%, and request totals stay within 2.5%.
The burst scenario sends 24 simultaneous 512-token prefills to an idle engine, so TTFT is queueing-dominated (burst TTFT p50 1.2s / p99 2.0s vs poisson's 58ms / 150ms on the same config).
Per-concurrency-bucket rows shuffle under bursts (admission order inside a burst is not deterministic), which is why the gate compares pooled quantiles plus per-request decode totals.
Replayed prompts are unique-token synthetics: the captured workloads carry
cached_tokens: 0, and identical fill tokens would silently turn every replayed
request into a prefix-cache hit. Workloads with prefix reuse, such as multiturn and
agentic traces, also need prefix structure replayed; that is the next scenario.
To reproduce against any trace with arrival_ms:
# capture: any OpenAI-compatible target
uv run --with httpx deploy/trace-capture/loadgen.py --url http://127.0.0.1:8000 \
  --model Qwen/Qwen3-8B --pattern poisson --rate 4 --duration 120 \
  --prompt-tokens 512 --output-tokens 128 --out run.json --trace-out client.jsonl

# replay the schedule, fitting the model from a different capture
just replay tap-poisson.jsonl /tmp/fit.jsonl

# real-vs-replay survival curves (replay measurements via --dump-trace)
just compare "real=tap-poisson.jsonl" "replay=replay-measured.jsonl"
Prefix cache and agentic multiturn
The agentic scenario (loadgen.py --pattern multiturn) models sessions, not isolated
requests. Sessions arrive poisson at --rate; each session runs --turns closed-loop
turns whose context grows by the turn's prompt plus the model's response, on top of
one of --prefix-count shared --prefix-tokens prefixes. The validation run below
is about 100 sessions x 5 turns over two ~10k-token shared prefixes; 493 of 495
requests were prefix-cache hits.
Prefix caching is not a latency knob. The engine runs a block-pool prefix cache;
admission computes each request's cached-token count, the trace-fitted TTFT model
conditions on the uncached prompt size, and a prefill admission stalls concurrent
decodes by its uncached tokens. Replaying prefix-cache workloads requires the workload's
sharing structure. The tap fingerprints every prompt with chained per-block hashes
(block_hashes), and replay expands each distinct hash to one deterministic token
block. Replayed prompts therefore share prefixes at the same block boundaries as the
capture.
Two replay modes apply. Pure open-loop replay fires every turn at its recorded offset.
--replay-sessions restores the generator's semantics: turn N+1 fires when turn N
completes plus the recorded think gap, with sessions inferred from the hash chains.
Session pacing matches closed-loop client behavior. Cold turns take seconds, so later
turns are delayed by prior responses; open-loop replay would fire every turn on the
original warm schedule.
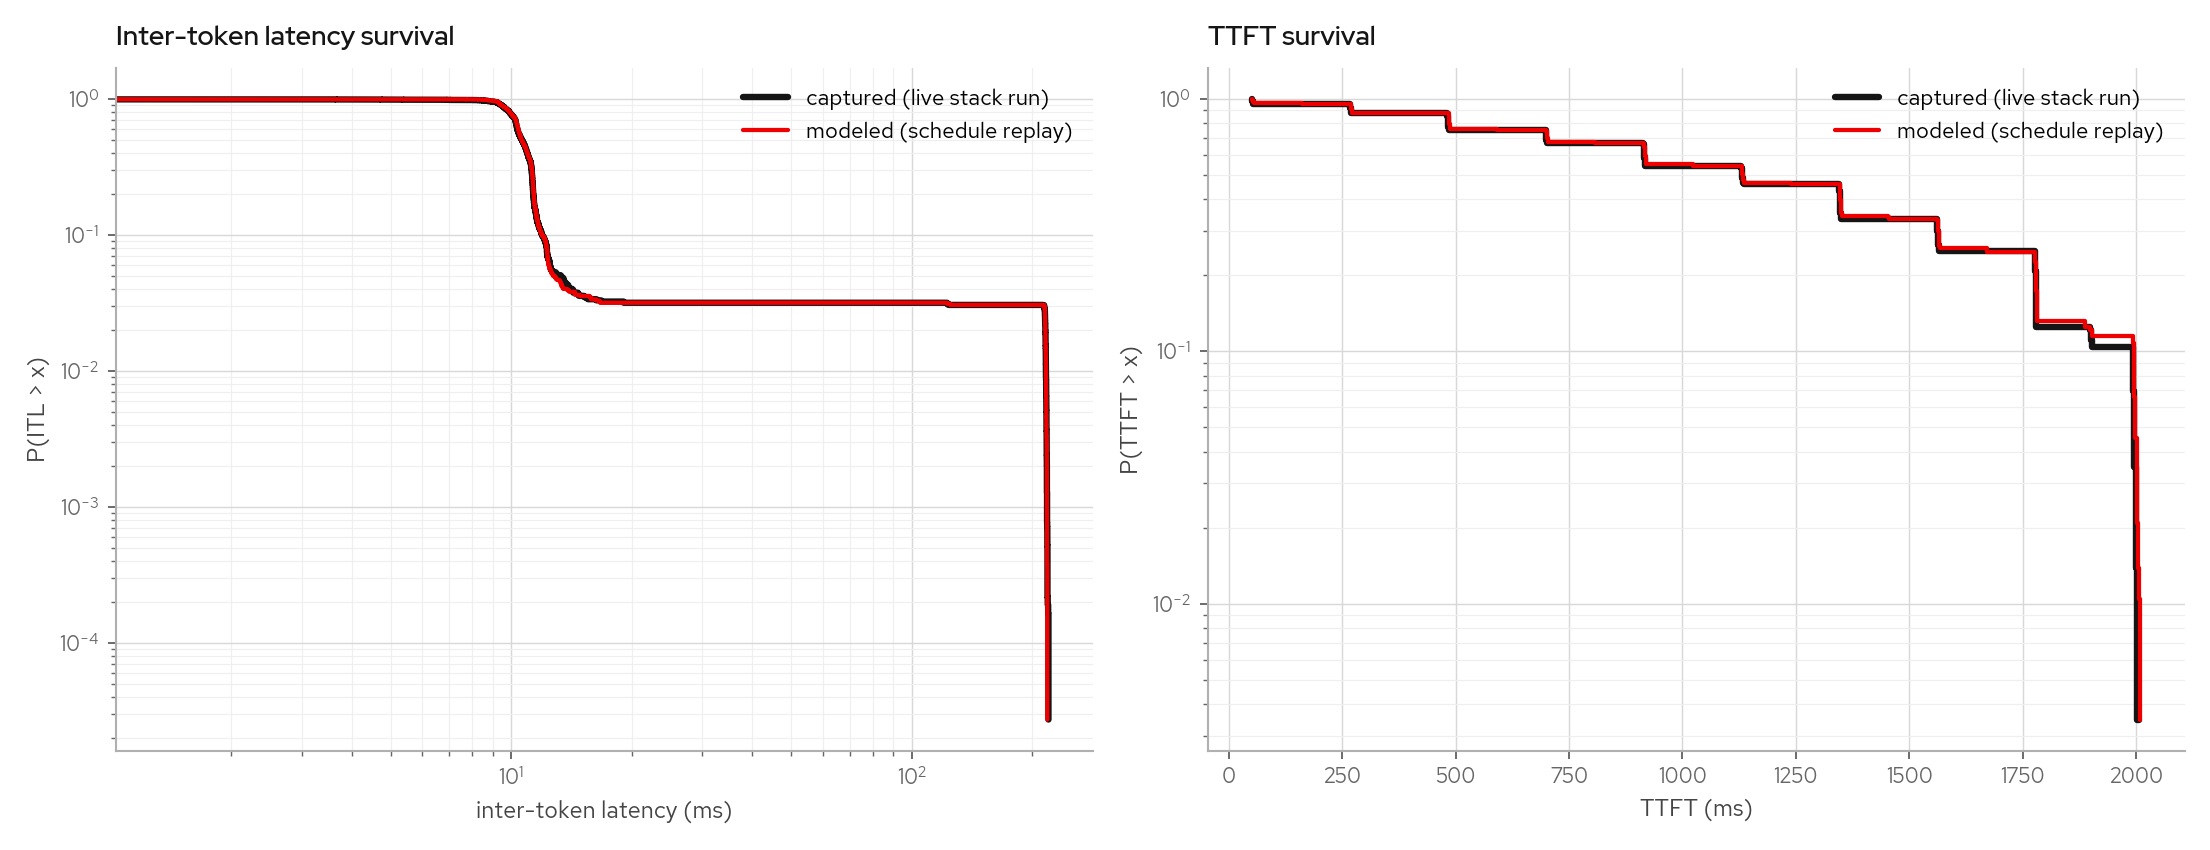
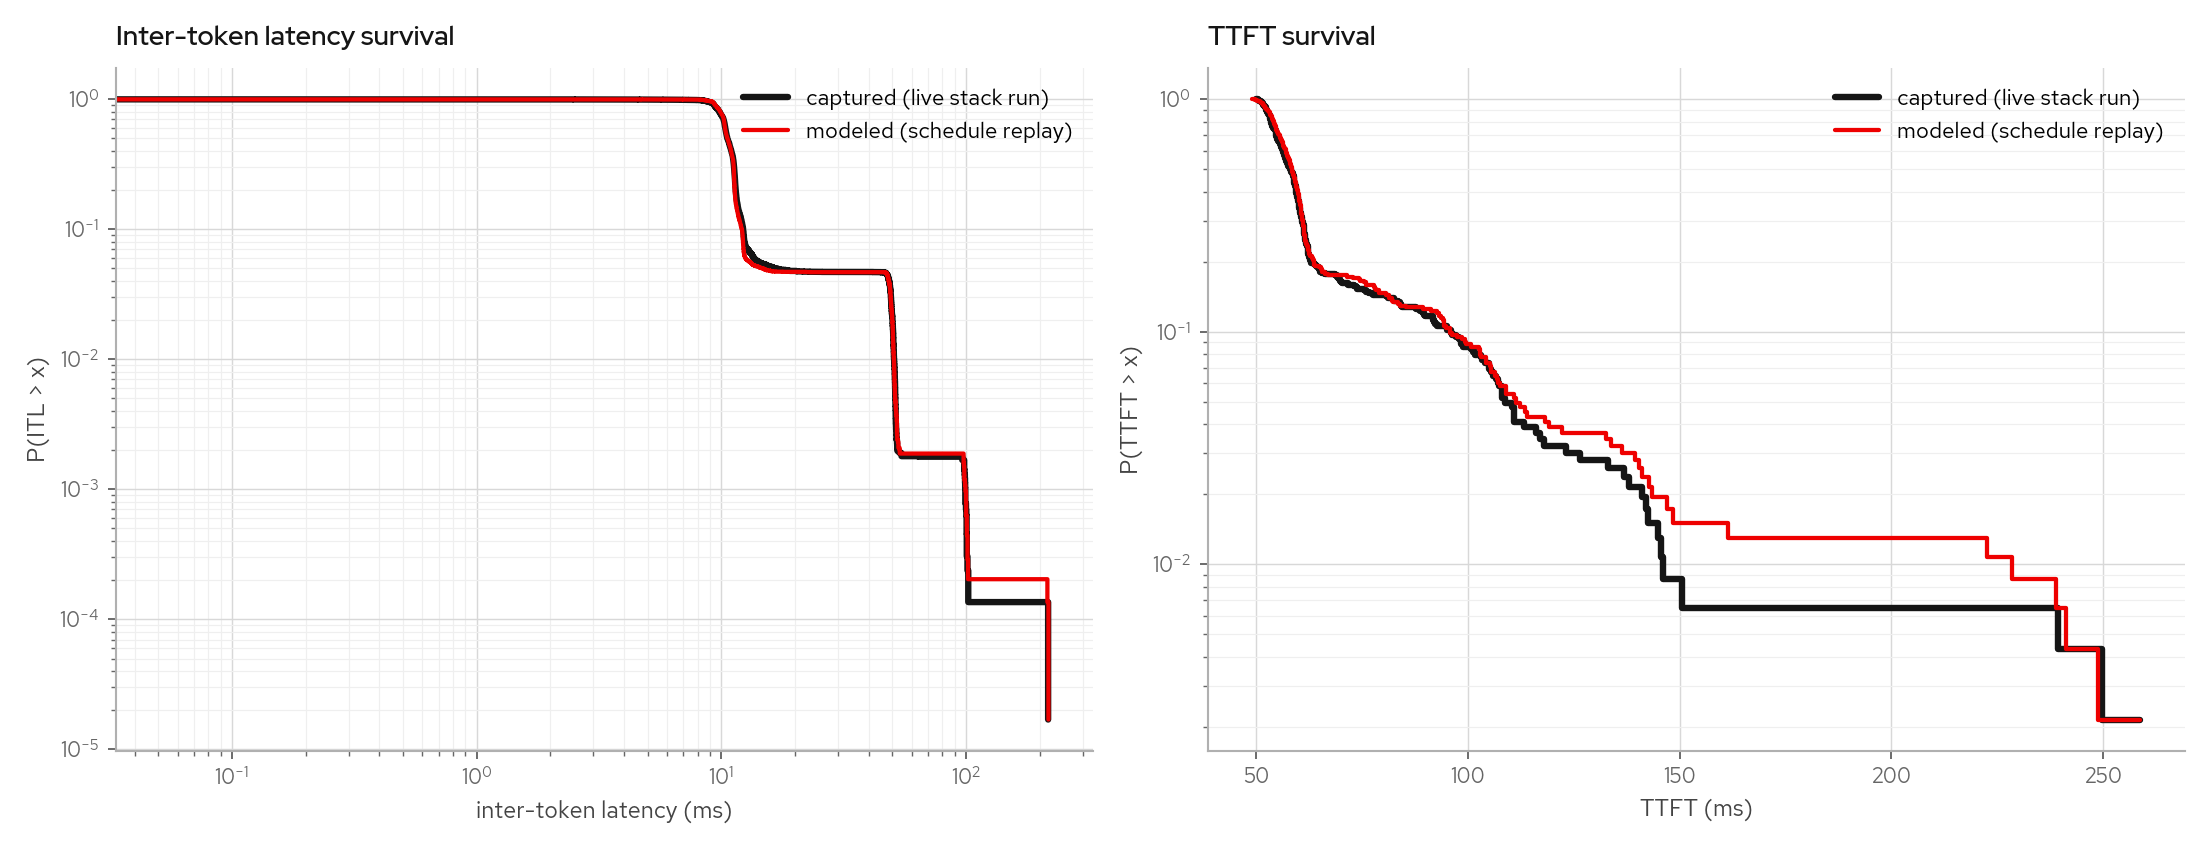
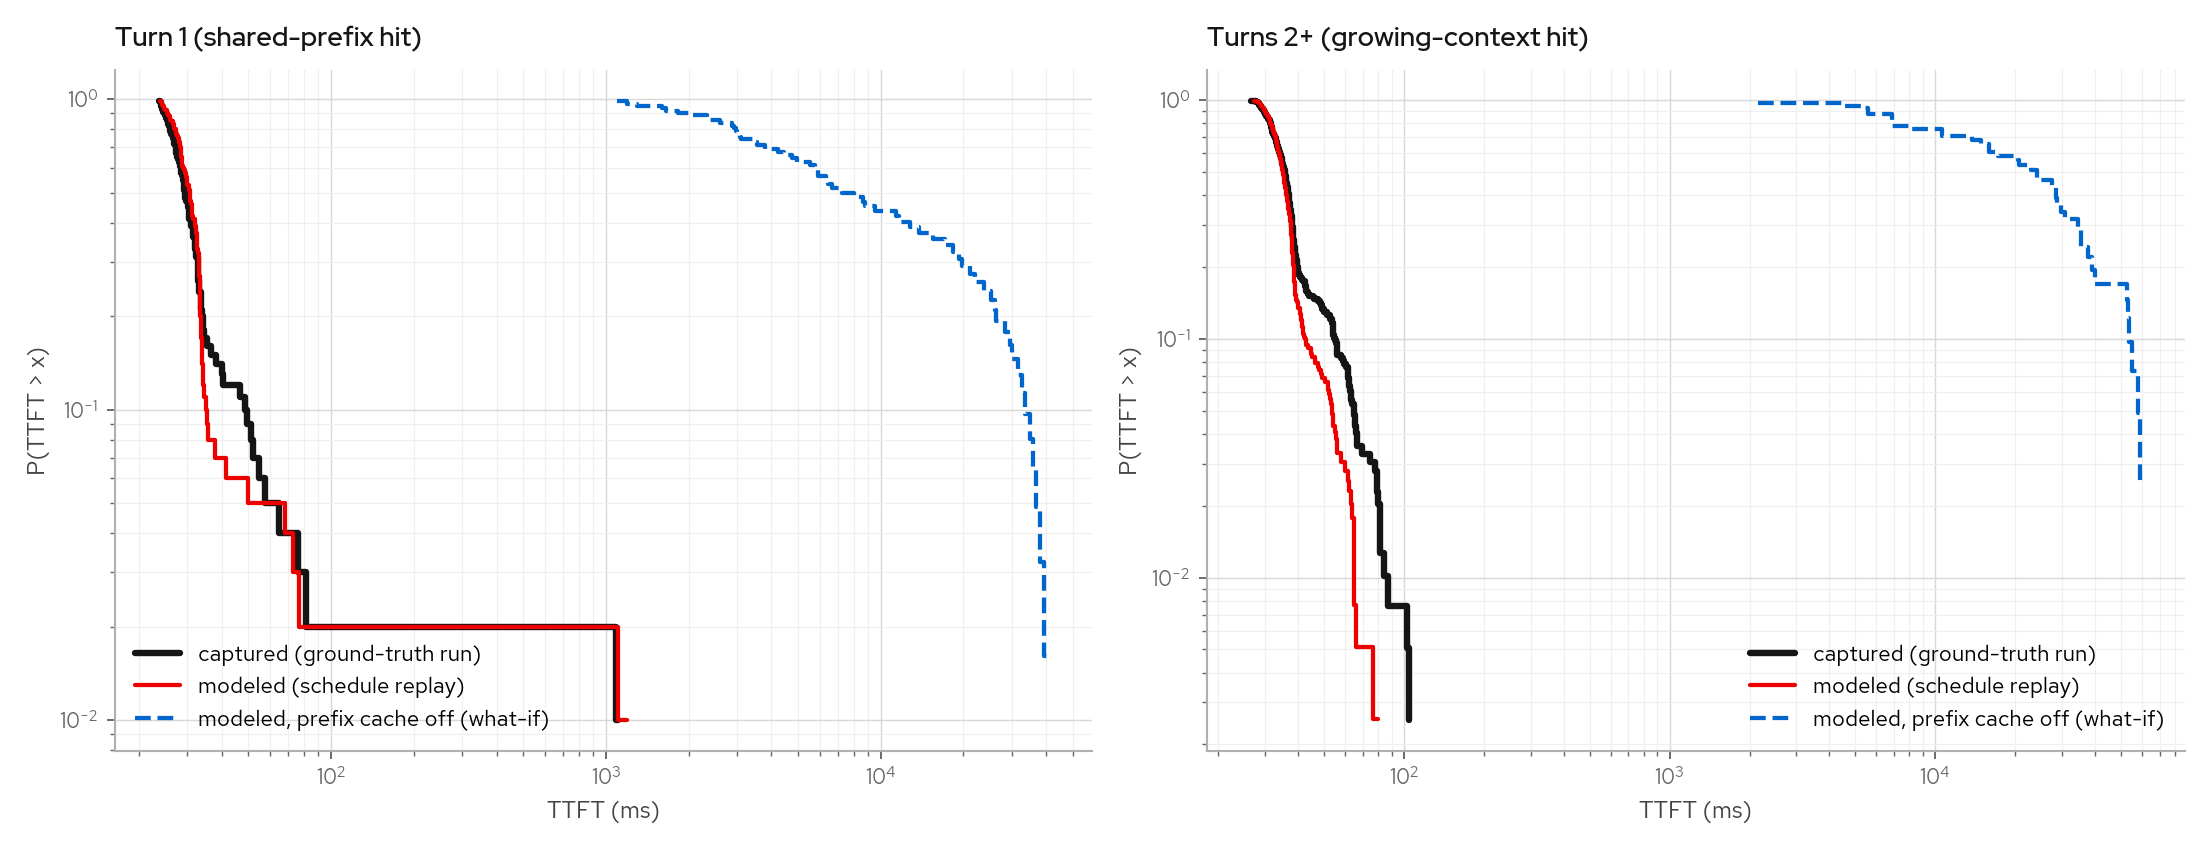
The figure shows captured vs modeled TTFT survival per turn cohort (turn-1 requests:
shared prefix hit only; turns 2+: growing context), plus the same schedule replayed
with --cold-prompts (prefix reuse disabled). Without the cache, every turn
re-prefills ~11k tokens and offered prefill load exceeds engine capacity. On turns 2+,
TTFT p50 changes from 36ms to ~24s and p99 from 87ms to ~59s, with closed-loop
sessions enabled.
# capture an agentic workload (10k-token shared prefixes at ~1.5 tokens/word)
uv run --with httpx deploy/trace-capture/loadgen.py --url http://127.0.0.1:8000 \
  --model Qwen/Qwen3-8B --pattern multiturn --rate 1 --turns 5 \
  --prefix-tokens 6500 --prompt-tokens 128 --output-tokens 128 --duration 120 \
  --out run.json

# session-paced replay, then the cache-off replay
cargo run --release --bin vllm-vcr -- inspect calibrate-e2e tap-multiturn.jsonl \
  --replay-arrivals --replay-sessions --latency-trace /tmp/fit.jsonl \
  --sim-arg=--kv-cache-size --sim-arg=65536 --dump-trace replay-measured.jsonl
cargo run --release --bin vllm-vcr -- inspect calibrate-e2e tap-multiturn.jsonl \
  --replay-arrivals --replay-sessions --cold-prompts ... --dump-trace nocache-measured.jsonl

# per-cohort figure
uv run scripts/plot_calibration.py --cache-effect real=tap-multiturn.jsonl \
  --cache-effect replay=replay-measured.jsonl --cache-effect nocache=nocache-measured.jsonl \
  --out-dir docs/images
The cold replay uses the chunk-cost model validated by the cold-multiturn counterfactual gate at this prompt scale. Workload traces with block-hash ids, lengths, and timestamps map onto this schema.
Content-identical replay
By default, traces include timing, shapes, and prefix structure (block hashes), but not
tokens. The tap's --record-tokens option adds each request's output_token_ids to
the trace. finish_reason is always recorded. With the same tokenizer, recorded token
ids decode back to generated text, so token-recording traces can contain user content.
On the replay side, vllm-vcr play --replay-tokens <trace> serves the recorded ids
verbatim instead of random tokens and ends each stream with the recorded finish
reason. --replay-match controls request-to-record matching:
index(default): the trailing-<index>of the request id, where the index is the record's position in the arrival-ordered schedule (the replay harness names requestsreplay-{i}). This requires replay-generated request ids. Combined with arrival replay, it reproduces the captured token stream on the wire.prefix: the incoming prompt's chained block hashes are matched against the records'block_hashes, longest shared prefix wins, ties go to arrival order, and each record is consumed by its first match (a duplicate prompt takes the next duplicate record; once all are consumed, retries re-serve the best match). The matched stream ends where the capture did: the engine clamps the live request'smax_tokensto the recorded length. This supports closed-loop clients with their own request ids, such as an agent loop re-run against the simulator. Because block hashes are chained, a tail change in a prompt shortens the match depth without changing earlier block matches.
Unmatched requests fall back to random tokens in both modes. These modes provide
deterministic streams for testing routers, EPPs, guardrails, and client SDK streaming
behavior without a GPU. Prefix mode can replay a closed-loop agentic workload offline
when the agent is deterministic; tests/closed_loop_prefix_replay.rs covers that
case.
Every trace touchpoint (--trace-out, --latency-trace, --replay-tokens, trace
conversion and replay harnesses) reads and writes gzip transparently when the path ends
in .gz; token-recording traces grow by one integer per generated token, so
compressing them is recommended.
Replay pacing
Content replay (--replay-tokens) and timing are independent. Pick the content mode
first, then choose how quickly and in what shape the engine should emit chunks.
| Mode | Invocation |
|---|---|
| Timing-modeled | --replay-tokens trace.gz --latency-trace trace.gz plus scheduler args matching the capture (--max-num-seqs, --max-num-batched-tokens, ...): gaps and burst sizes sampled from a model fitted to the trace |
| Timing-verbatim | --replay-tokens trace.gz --replay-steps trace.gz: each request replays its recorded per-chunk sizes and gaps |
| As fast as possible | --replay-tokens trace.gz and nothing else: all timing knobs default to 0, the instant model |
| Compressed but shaped | --replay-tokens trace.gz --latency-trace trace.gz --time-scale 100: same interleavings and relative ordering, 100x faster wall clock |
| Synthetic timing | --replay-tokens trace.gz --time-to-first-token 50 --inter-token-latency 10 |
For the fast path, scheduler limits still apply at zero delay. --max-num-seqs and the
token budget control queueing and backpressure; increase them for pass-through replay.
--output-token-chunk-size controls output framing.
Speculative decoding and diffusion
Speculative decoding and diffusion can emit multiple tokens from one engine step. A step can deliver one verified token plus accepted drafts, or a diffusion block. Capture and replay preserve this chunk structure.
On the capture side the tap records, per output chunk, one itl_ms gap and the number
of tokens that chunk delivered in a parallel itl_tokens array (omitted for plain
autoregressive captures, so old traces are unchanged). The first chunk has no gap; its
size is output_tokens - sum(itl_tokens). With --step-stats-out the tap also writes
a per-step SchedulerStats sidecar, which under speculative decoding carries
spec_decoding_stats (per-position acceptance) from the vLLM engine.
There are two replay modes for this structure:
- Modeled (
--latency-trace): the latency model draws the recorded(gap, tokens)pairs jointly from donor pools fitted to the capture. A step the capture saw deliver four tokens replays as one four-token message after a sampled gap, never four messages at gap/4. It reproduces the burst distribution, not an individual request's recorded sequence, so sampling drift is expected. - Replay (
--replay-steps): each matched request emits its recorded chunk sizes at its recorded gaps (the timing analogue of--replay-tokens; requests resolve to records via--replay-match). This mode replays recorded timing but does not transfer to a different workload.
Either way the simulator re-derives spec_decoding_stats from the bursts it emits:
speculative budget K = max(itl_tokens) - 1, with a burst of N tokens reported as 1
target token plus N-1 accepted drafts. Scheduler stats therefore use the same
structure as the capture. Autoregressive traces report no spec stats, matching a vLLM
engine with speculation off.
# 1. Capture: vLLM engine with ngram spec decode behind the tap (writes
#    tap-trace.jsonl + step-stats.jsonl). See deploy/trace-capture/ for manifests.
just capture-up && bash deploy/trace-capture/run-capture.sh && just capture-down

# 2. Replay the recorded schedule with verbatim per-request bursts and gaps.
cargo run --release --bin vllm-vcr -- inspect calibrate-e2e \
    /tmp/trace-capture-h200/tap-trace.jsonl --replay-arrivals \
    --sim-arg=--replay-steps=/tmp/trace-capture-h200/tap-trace.jsonl \
    --dump-trace /tmp/spec-replay.jsonl

# 3. Plot capture vs replay: burst sizes, per-chunk pacing, acceptance.
uv run scripts/plot_calibration.py \
    --spec-fidelity real=/tmp/trace-capture-h200/tap-trace.jsonl \
    --spec-fidelity replay=/tmp/spec-replay.jsonl \
    --spec-steps real=/tmp/trace-capture-h200/step-stats.jsonl \
    --out-dir docs/images
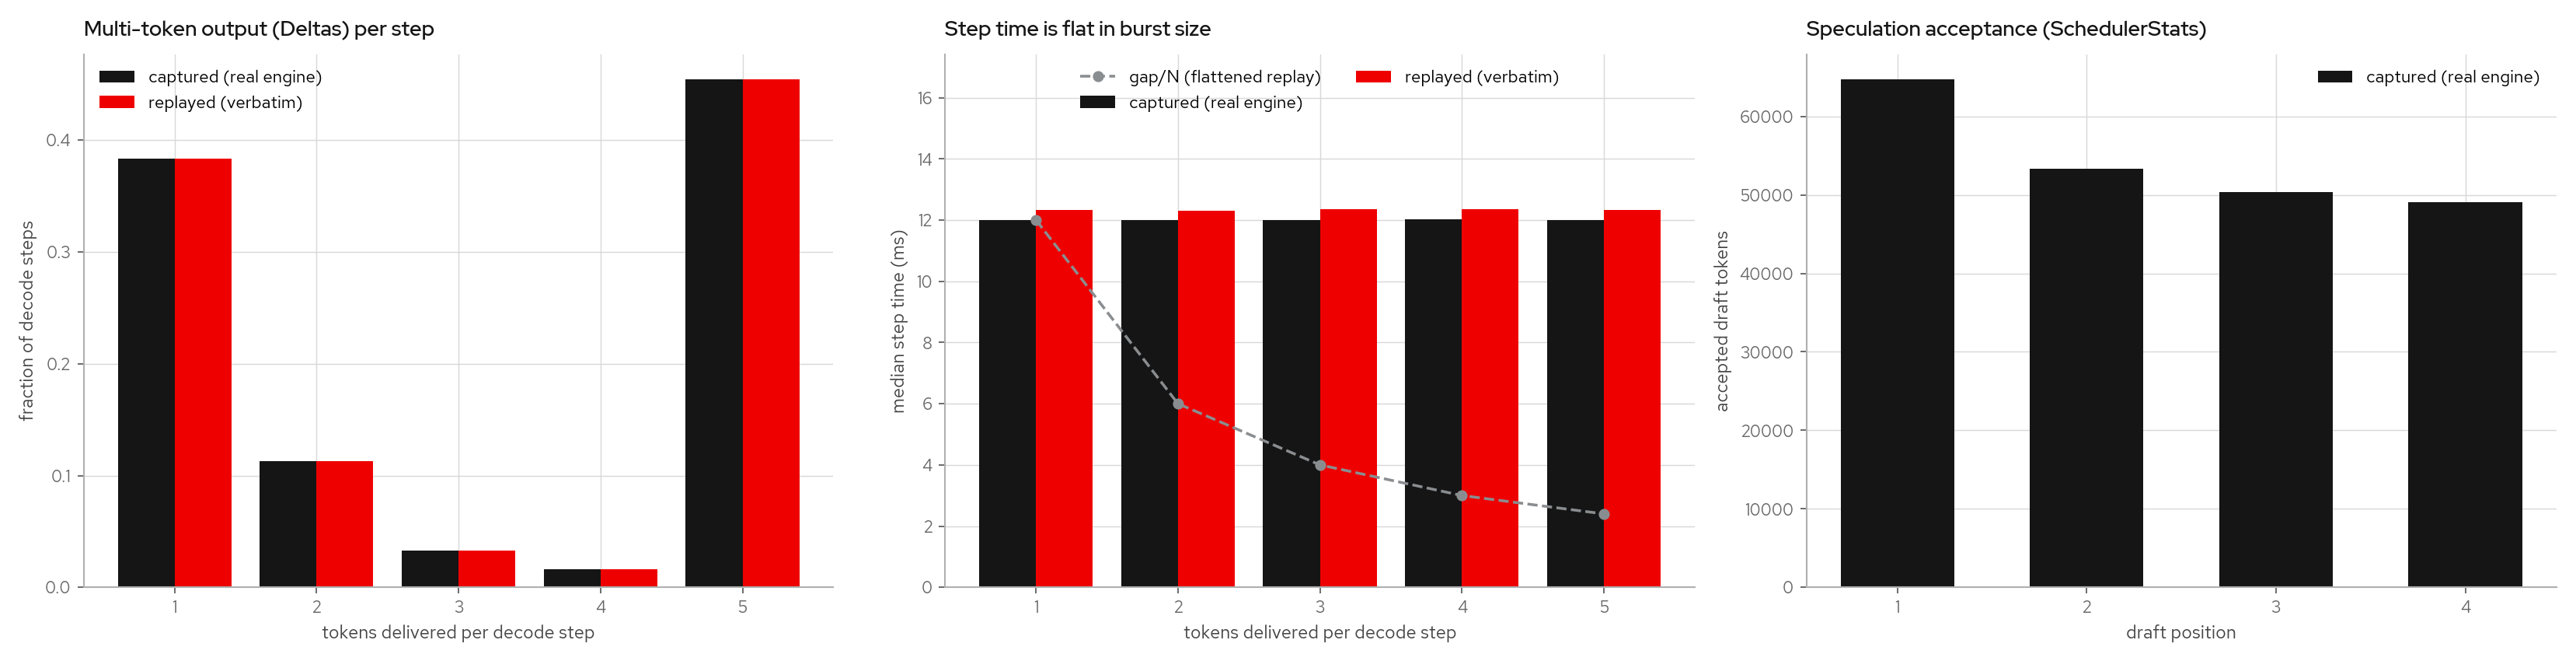
The figure is the verbatim --replay-steps path (a 4096-record Qwen3-8B run; ngram on
this workload accepts often, so ~45% of steps deliver the full 5 tokens). Left: tokens
delivered per decode step, captured vs replayed. Middle: step time vs burst size;
speculation verifies all K drafts in one target forward pass, so median step time is
~flat in the burst size (~12ms whether the step delivered 1 or 5 tokens). The dashed
line is the ~gap/N result that would appear if one chunk were split into N equal gaps.
Right: per-position draft acceptance read back from the SchedulerStats sidecar (pass
a second --spec-steps replay=... to overlay the simulator's own emitted stats).
Covered without a GPU by tests/spec_replay_fidelity.rs and replay_steps/engine unit
tests.
Perfetto trace viewer
Convert a JSONL engine trace into the Chrome Trace Event Format
and view it on https://ui.perfetto.dev. The converter is the perfetto
subcommand of vllm-vcr inspect; it reads the same trace files the replay and
calibration paths use (.gz transparent), and optionally overlays the tap's
step-stats sidecar.
For the trace schema itself, see crates/sim-trace/src/trace.rs; for the sidecar,
crates/sim-protocol/src/step_stats.rs.
Contents
Quick start
Write a Perfetto JSON file and drag it onto https://ui.perfetto.dev:
cargo run --bin vllm-vcr -- inspect perfetto trace.jsonl -o trace.perfetto.json
Or let it serve the trace and open the UI for you (blocks until Ctrl-C, since the hosted UI fetches the file from this process):
cargo run --bin vllm-vcr -- inspect perfetto trace.jsonl --open
Overlay the step-stats sidecar (vllm-vcr record --step-stats-out) for the
batch-level counters and the per-step scheduler track:
cargo run --bin vllm-vcr -- inspect perfetto trace.jsonl \
  --step-stats trace-step-stats.jsonl --open
What you see
Two process groups, both on one shared clock (milliseconds since capture start;
arrival_ms and the sidecar's ts_ms use the same zero).
inference trace — the per-request shapes. Each request is a prefill span
(arrival → first token) followed by one decode span per inter-token gap
(itl_ms), with multi-token chunks (spec decode, diffusion blocks) named
decode xN. Requests are packed into reusable lanes: a lane frees the moment its
request finishes, so the row count is the peak concurrency, not the request
count (a 2500-request trace becomes ~16 lanes). Under it sit counter tracks:
| Counter | Source | Meaning |
|---|---|---|
active_requests | swept from the spans | in-flight request depth over time |
engine_running | itl_ctx.num_running | engine-reported running count per decode gap |
prefill_tokens | itl_ctx.prefill_tokens | prompt tokens that finished prefill in the gap's step |
sched_running_reqs / sched_waiting_reqs | sidecar | scheduler batch and queue depth |
sched_kv_cache_usage | sidecar | KV-cache pressure (0–1) |
sched_accept_rate | sidecar | spec-decode acceptance rate (only when drafting) |
scheduler steps (with --step-stats) — one span per executed scheduler
step, back to back on a single row (steps are sequential, so they never overlap).
Each step is classified and colored by what it ran: decode B<n>, prefill, or
prefill+decode B<n> (+<r>r <t>t). A prefill step is visibly wider (it costs more),
and the args carry running / waiting / prefill_requests / prefill_tokens /
kv_cache_usage / step_ms and spec accepted/draft.
Spans are colored by phase so the language is consistent across both groups:
orange = prefill, green = decode, with a distinct shade for a mixed
prefill+decode step. Recorded output token ids (tap --record-tokens) ride each
span's token_ids arg, the hook for a future detokenize-to-text mode.
Options
| Flag | Effect |
|---|---|
-o, --output <path> | Write the JSON here (default: stdout, or nothing with --open) |
--step-stats <path> | Overlay the step-stats sidecar (.gz ok): counters + the step track |
--name <label> | Override the process-row label (default: the trace's model) |
--track-per-request | One labelled row per request instead of packed lanes (good for small traces) |
--open | Serve over localhost and open the Perfetto UI; blocks until Ctrl-C |
--port <n> | Port for --open; default 0 lets the OS choose a free ephemeral port |
Records without an arrival_ms cannot be placed on a timeline and are dropped
(the command prints how many); guidellm-converted and gen-demo traces have none,
real tap captures do.
Fidelity: request shape vs scheduler steps
The two views answer different questions, and the difference matters when reading overlap.
The request shapes are a reconstruction of each request's client-observed
latency envelope: the prefill span is arrival → first token, which fuses
queue-wait and prefill compute into one contiguous bar, and the decode bar is the
observed inter-token cadence. Under load these bars overlap heavily, but that
does not mean the engine ran that many prefills at once. With chunked prefill,
the engine runs roughly one prefill chunk per step, interleaved with decodes, and
much of a prefill bar under saturation is queue-wait, not compute.
The scheduler steps track is the truthful counterpart: it shows what the engine
actually executed each step, sequential and non-overlapping, including where a
prefill chunk genuinely co-occurred with decodes in one step (prefill+decode).
Reach for the request shapes to see per-request experience (what replay cares
about), and the step track to see scheduler occupancy.
Notes and limits
- Times are emitted in microseconds (the Chrome format's unit);
displayTimeUnitis set tomsfor the axis. - Timestamps are relative to capture start, not wall-clock epoch, so a trace is self-contained but not directly correlatable with an external profiler.
--openruns a minimal localhost HTTP server with permissive CORS so the hosted UI can fetch the file. The trace stays on your machine; the browser fetches it from127.0.0.1.- Large traces produce large JSON (a ~2500-request capture is ~50 MB / ~370k events); the UI loads it fine but the default zoom fits the whole capture.
vLLM version mapping and release automation
Goal: support a rolling N-3 window (latest vLLM release plus the three before it) from a single repo, with automation that catches protocol drift the day a new vLLM lands and ships one clearly-labelled artifact per supported line.
Where vLLM version actually bites
Only one axis is a hard compile-time coupling. The rest are behavioral and get caught by tests, not the compiler.
| Axis | Where it lives | Breaks on version bump? |
|---|---|---|
| Wire protocol | vllm-engine-core-client git rev → the ~6 imported types (HandshakeInitMessage, ReadyMessage, EngineCoreFinishReason, ModelDtype, encode/decode_msgpack) | Hard. Cargo allows exactly one rev of a git dep per build. This is the whole problem. |
| Registration schema | SimReadyResponse in crates/sim-protocol/src/frontend_connect.rs | Soft, but already drifted (see block_size note below). We own a superset, so we absorb adds. |
| Metrics surface | vllm:* Prometheus gauges (e.g. the #45030 lora_requests_info move) | Soft. Behavioral, caught by e2e*.sh. |
Frontend (vllm-rs / python) for e2e | scripts/e2e*.sh | Must match the protocol rev under test. |
| Scheduler / step model | src/ step engine | Soft. Doesn't break the build, shifts replay error (chunked-prefill defaults etc.). Re-validated per line via the figure/gate harness. |
The trace and modeling crates (sim-trace, src/ model) are already
vLLM-protocol-free. So "support N-3" is almost entirely a sim-protocol +
build-matrix problem, which is what makes the matrix approach cheap.
Decision: build matrix, one artifact per line
Cargo cannot hold two revs of the same git dep in one build. A single binary speaking four protocols would mean vendoring the wire structs into per-version modules behind a trait. The surface is small (~6 types) so it isn't insane, but msgpack shapes can diverge in ways a trait can't paper over, and it is real standing maintenance.
We commit to the build matrix: one image per supported vLLM line, a
manifest-driven CI matrix, and the handshake vllm_version field used to reject
mismatches loudly rather than silently mis-speak the wire. Revisit the
single-binary path only if the protocol surface stays this small and we have a
concrete reason to ship one image.
Source of truth: compat.toml
A manifest at repo root defines the support window. The manifest diff is the release.
# compat.toml — the rolling support window. Oldest release line drops as N advances.

[[vllm]]
line = "nightly"              # tracks vLLM main for drift detection
tag  = "nightly"
protocol_rev = "9c7c74bf..."
fidelity_validated = false

[[vllm]]
line = "0.23"                 # current default line
tag  = "v0.23.0"              # vLLM release tag; also the e2e frontend version
protocol_rev = "17bc1445..."  # rev for vllm-engine-core-client at this line
fidelity_validated = false    # flips true once replay gates validate goldens
default = true                # what :latest / unsuffixed builds point at

[[vllm]]
line = "0.22"                 # older supported release line
tag  = "v0.22.1"
protocol_rev = "0decac0d..."
patch_repo = "https://github.com/wseaton/vllm.git"
patch_rev = "b48f2434..."
fidelity_validated = false
Rules:
- Pin release lines to release tags, not arbitrary labels.
tagis the vLLM release label for the line.protocol_revis the vLLM git rev whose in-treevllm-engine-core-clientcrate the simulator builds against for that line. - Exactly one
default = true. That line is:latestand the unsuffixed build. - A line enters the window only when
fidelity_validated = true. New lines land asfalse, get capture+replay validation, then flip.
Versioning: keep the two axes orthogonal
The sim's own semver (0.1.0 → ...) tracks its features. vLLM compatibility
is build metadata, expressed in the image tag, never baked into the sim semver.
Conflating them is the classic mistake.
Image tags:
vllm-vcr:0.3.0-vllm0.23— immutable, the real artifact (sim version × vLLM line).vllm-vcr:vllm0.23— floating, latest sim for that line.vllm-vcr:latest— sim-head × thedefault = trueline.
CI matrix mechanics
The rev is swapped in Cargo.toml, NOT via --config patching. Cargo rejects a
[patch] that points a git dependency at a different rev of the same source
("patches must point to different sources"), so --config 'patch...rev=...'
fails for every line (including the head). The per-line build instead rewrites
the manifest in a throwaway checkout:
cargo xtask pin-vllm "<line>"   # reads compat.toml, edits Cargo.toml
cargo build --workspace               # no --locked: the rev changed
cargo xtask pin-vllm sets the rev in [workspace.dependencies] and rewrites or
removes the fork [patch] from the line's patch_repo/patch_rev (the head
line carries the #45848 fork; lines without a fork build against protocol_rev
upstream). compat.toml stays the single source of truth.
On main and tags the matrix builds + runs the replay gates against every line.
That is the payoff: the day vLLM N+1 lands, the matrix tells us whether the wire
still parses before we promote anything. Lines that are not yet
fidelity_validated run non-gating (job-level continue-on-error), so a line
with real API drift (e.g. a removed mock_engine module) surfaces as a
non-blocking annotation rather than blocking the merge.
Handshake version guard (do regardless of path)
The frontend registration already carries vllm_version
(frontend_connect.rs:43). On connect, assert the peer's version is in the
artifact's supported set and refuse with a clear error otherwise. That turns
"silent msgpack corruption" into "this image speaks vLLM 0.23, peer is 0.22,
abort." Cheap, high value, independent of the matrix.
Rotation when N advances
When vLLM cuts N+1:
- Add it to
compat.tomlwithfidelity_validated = false. - Matrix builds it; run capture + replay to validate fidelity.
- Flip
fidelity_validated = true, movedefaultto the new line. - Drop the now-N-4 line from the manifest.
Build order
compat.toml+ handshake version guard. Small, immediately useful, makes mismatches loud. Done.- Manifest-driven CI matrix + conformance runner. The real automation payoff.
Done (per-line build/unit/conformance; see
conformance.md). - Compatibility shim for the protocol crate's per-line API drift. Done for
the 0.22 line; see
multi-version-shim.md(capability cfgs + owned/tolerant decodes,cargo xtask pin-vllm). This is what lets onemainbuild against multiple lines without a single multi-version binary. - Nightly canary (
.github/workflows/nightly-canary.yml). Thenightlyline is pinned and only moves when bumped; the canary instead pins to the LIVE upstream main HEAD each night (cargo xtask pin-vllm nightly --rev <sha>), builds, runs unit tests, runs the HEAD-client protocol e2e tests, runs the conformance runner, and publishes a rollingnightlyprerelease with the sha in its notes. A red scheduled run is the early warning that upstream moved the engine-core protocol. Done.
Open coupling note: the block_size / registration drift
The python frontend's EngineCoreReadyResponse requires six fields including
block_size (tokens per KV block). The upstream Rust
vllm-engine-core-client::EngineCoreReadyResponse still has only five and is
missing block_size — confirmed at both the pinned c9340e6 rev and
upstream main as of 2026-06-13. Re-encoding through the crate's struct silently
drops the field and the python frontend rejects the registration.
Our workaround is the forward-compatible path that already exists: the sim emits
its own complete SimReadyResponse superset, and the tap relays the real
engine's response bytes verbatim (immune to future adds). This is the kind of
schema drift the matrix is meant to track; if upstream ever adds block_size to
the Rust struct we can drop SimReadyResponse for that line, but until then the
superset stays. Keep the sim_ready_response_carries_all_python_required_fields
test as the canary.
Conformance testing
The matrix above answers "does this line still build and parse the wire." Fidelity (does the sim still reproduce the engine's behavior for a line) is answered by conformance testing: a profile-once/replay-many loop that pairs a manifest of golden captures with a GPU-free replay in CI. The capture runbook is conformance.md; this section ties the pieces together.
Three artifacts cooperate:
compat.toml— the N-3 window (above). Each line carriesfidelity_validated, which gates whether its conformance failures block promotion.conformance/manifest.toml— one[[golden]]entry per captured trace, withline,bucket_path,sha256,config_hash,workload, androle(schemaorfidelity). The captures themselves are NOT in the repo; they live in a private bucket and CI fetches them by sha.- The capture runbook (conformance.md) — how a golden gets captured on the GPU cluster, uploaded, and registered.
The CI flow (.github/workflows/ci.yml):
compat-matrixparsescompat.tomlinto a per-line build matrix.- The
conformancematrix job builds + tests each line against its ownprotocol_rev(the--configpatch from "CI matrix mechanics"), then fetches that line's goldens by sha, verifies the sha256, and replays them GPU-free, asserting the trace'sconfig_hash(the profile-once/replay-many cache key,--expect-config-hash). - Lines with
fidelity_validated = falsebuild and run conformance, but their fidelity failures are continue-on-error (see "Rotation when N advances"): a freshly added line gets signal without blocking the merge. Flipfidelity_validated = trueonce the golden validates, and the leg becomes a hard gate.
The replay-many half needs no GPU and is the same mechanism as the offline replay rig
(deploy/trace-capture/base/offline-replay.yaml): the python frontend talks to
vllm-vcr play serving the captured trace, with no real engine behind it. CI runs it
headlessly; the rig serves a live agent the same byte-identical streams.
Multi-version vLLM support: the compatibility shim
How the simulator builds against more than one vLLM line from a single main
branch. Read versioning.md first for the strategy (build matrix, one image per
line, compat.toml as source of truth) and conformance.md for capture/replay.
This doc covers the code side: how we absorb the protocol crate's API drift.
Contents
- The shape of the problem
- Per-line builds: pin, don't patch
- Capability cfgs
- What the shim owns
- Testing across lines
- Current window
- Follow-ups
The shape of the problem
The wire protocol comes from one git dependency, vllm-engine-core-client,
which lives in the vLLM repo (rust/src/engine-core-client/). Its API drifts
across releases. Cargo can hold only one rev of a git dep per build, so each line
is a separate build (the matrix). The job of the shim is to let the same source
compile against each line's crate, isolating the divergences in one place.
Per-line builds: pin, don't patch
Cargo rejects a [patch] that redirects a git dependency to a different rev of
the same source ("patches must point to different sources"). So the per-line
rev is swapped in [workspace.dependencies], not via --config patch. build.rs
cannot do it either: dependency resolution happens before any build script runs.
cargo xtask pin-vllm <line> reads compat.toml and rewrites Cargo.toml: it sets
the vllm-engine-core-client rev to the line's protocol_rev, and inserts,
rewrites, or removes the fork [patch] to match the line's patch_repo/patch_rev
(a fork is a different source, so it is allowed to [patch]). The committed
Cargo.toml carries no [patch] block (the default line builds upstream), so
a forked line's block is inserted, not rewritten; the script strips any existing
block first, so it's idempotent. After the rewrite the rev no longer matches
Cargo.lock, so per-line builds omit --locked.
Gotcha: the script changes the manifest but not the environment, and
build.rs reads the line from VLLM_TARGET_VERSION (falling back to the
compat.toml default). So a per-line build must set both: run the script
and export VLLM_TARGET_VERSION=<tag>. The CI matrix does both; a local
older-line build must too:
cargo xtask pin-vllm 0.22
VLLM_TARGET_VERSION=v0.22.1 cargo build --workspace   # no --locked
Capability cfgs
Where the crate's API genuinely diverges in a way owning a type can't hide (a
field whose type differs per line), the engine gates on a discrete capability,
not a version number. build.rs maps the target line to cfgs and declares them
with cargo::rustc-check-cfg:
vllm_lora_typed— the crate exposes a typedprotocol::loramodule andEngineCoreRequest.lora_request: Option<LoraRequest>. On 0.23+. On 0.22 lora is opaquermpv::Value.
cfgs from build.rs only reach the crate that owns the build script (the root
crate) and its targets (incl. its tests/). Keep cfg-gated code in the root crate.
rust-analyzer does not run build.rs, so it shows false-positive errors on the
inactive cfg branch; cargo build is the truth.
What the shim owns
The principle: own a tolerant decode wherever possible (no cfg), and reach for a capability cfg only when a field's type differs per line. Owned types deserialize the same wire on every line (serde ignores unknown fields).
| Concern | Divergence | Shim |
|---|---|---|
| Handshake harness types | mock_engine module absent before 0.23 (we never used its behavior, only structs) | sim-protocol::mock_engine owns MockEngineSockets/MockEngineDataSockets/MockCoordinatorSockets + DEFAULT_MOCK_MAX_MODEL_LEN + default_dtype() |
| Request-type frame | EngineCoreRequestType::from_frame is head-only | sim-protocol::wire::request_type_from_frame (1-byte decode) |
| Lora request | typed LoraRequest (0.23+) vs opaque rmpv (0.22) | LoraSpec{lora_int_id,lora_name} (own, decodes both) for the add_lora call + registry; request_lora_name() is the one vllm_lora_typed-gated fn for the lora_request field |
| Ready response | EngineCoreReadyResponse.vllm_version absent before 0.23 | tap decodes its own tolerant CapturedReadyInfo{vllm_version:Option<String>} |
| Utility request | EngineCoreUtilityRequest derives Deserialize only on 0.23+ (crate was client-only) | engine_core::UtilityRequestSpec (Deserialize_tuple, matches the wire tuple) |
The wire types still come from the crate (the matrix's whole point: catch drift at compile time). The shim only covers the spots where our decoding/server role needs something the client-oriented crate lacks on an older line.
Testing across lines
The matrix runs per line (see ci.yml):
cargo build --workspace— the "does the wire still compile" gate.cargo test --workspace --lib— unit tests (compile + pass on every line).cargo test --test conformance— the conformance runner (skips until goldens).
The full-stack e2e integration tests (tests/engine_core_e2e.rs,
tests/tap_e2e.rs) drive the real EngineCoreClient, whose API
is incomplete on older lines, so they target the default line via the
build-and-test job, not each matrix leg. The lora lifecycle
e2e test is #[cfg(vllm_lora_typed)] so the workspace still compiles tests on
lines that have the typed client.
Current window
- nightly (
nightly): tracks vLLM main,protocol_revis the latest post-merge commit (bumped regularly). No fork (main carries everything). build.rs treats the non-vX.Ytag as the newest line, so all capability cfgs are on. It exists to catch wire drift before a release lands: the live-HEAD nightly canary pins to upstreammain, builds, runs unit tests, runs the HEAD-client protocol e2e suite, and runs the conformance runner.fidelity_validated = falsebecause nightly has no golden capture set yet. - 0.23 (
v0.23.0, default): builds against upstream17bc1445, unit tests + conformance green. No fork (#45848is upstream here). - 0.22 (
v0.22.1): library + bins + unit tests + conformance all build; the shim absorbs the build-time drift. Builds against the 0.22 crate (0decac0d)[patch]ed to thewseaton/vllmserde-defaults fork (see below).fidelity_validated = false(no captures yet). - 0.21 (
v0.21.0): the Rust crate did not exist at the v0.21.0 tag, so there is no 0.21 rev to build against. It builds against the same 0.22 crate + fork as the 0.22 line; only its tag label and goldens differ. The capture is what proves the 0.21 engine's wire actually matches the 0.22 client types; if it diverges, 0.21 grows its own shim.fidelity_validated = false.
The 0.22/0.21 serde-defaults fork
EngineCoreSamplingParams has no #[serde(default)] on its omittable fields at
0decac0d (the 0.22 crate), so the tap can't decode a real Python frontend's
msgspec omit_defaults request at capture time. This is a runtime decode issue,
not a build one, so it's a [patch] (a different source), not a protocol_rev
bump. The fix is vllm-project/vllm#45848 backported onto the 0.22 base:
- branch
wseaton/serde-defaults-0.22onwseaton/vllm, revb48f2434. - it adds the field defaults (temperature/top_p/repetition_penalty=1.0, max_tokens=16, the rest zero/None/empty) and nothing else.
- both the 0.21 and 0.22 lines carry it via
patch_repo/patch_revincompat.toml;cargo xtask pin-vllminserts the[patch]block per leg (the committedCargo.tomlhas none, since the default line builds upstream).
Follow-ups
- Capture a 0.22 golden and flip
fidelity_validated = trueonce it's uploaded, registered inconformance/manifest.toml, and the replay gate passes. - Capture a 0.21 golden against the 0.22-crate frontend image to confirm the
wire matches; flip
fidelity_validated = true(or add a 0.21 shim if it diverges).
Conformance capture runbook
How to capture a golden trace for one vLLM line, upload it to the private golden
bucket, register it in conformance/manifest.toml, and let CI flip that line to
fidelity_validated = true. This is the "profile-once" half of the
profile-once/replay-many model. The "replay-many" half is GPU-free and runs in CI
and on the offline replay rig.
For the version-mapping strategy this runbook serves (the N-3 window, compat.toml,
the build matrix, image tagging), see versioning.md. For the trace
schema, see crates/sim-trace/src/trace.rs.
The golden captures live in an object-store bucket that the CI workflow fetches from by sha; the concrete bucket, account, and fetch-role identifiers live only in
.github/workflows/ci.yml(CONFORMANCE_BUCKET). None of it is needed to build, test, or use the simulator: the GPU-free replay half runs from any trace you have. To run conformance against your own captures, pointCONFORMANCE_BUCKETand thebucket_pathkeys inconformance/manifest.tomlat a bucket you control.
Contents
- Capture topology
- What pins the vLLM version
- Capture hygiene
- Stand up a capture per line
- Fetch the trace + step stats
- Compute the config hash
- Upload + register the golden
- Flip the line to validated
- The GPU-free replay half
- Building the capture image on waldorf
Capture topology
The capture stack records the real engine's wire traffic without changing it. Three processes run as sidecars, the load generator drives them, and the tap writes the trace:
The engine runs --headless and binds the GPU. The tap dials the engine's
handshake, the frontend dials the tap's handshake, so the tap sits on the wire
between frontend and engine and copies every frame to trace.jsonl (and, with
--step-stats-out, the per-step SchedulerStats sidecar). Load comes from
deploy/trace-capture/loadgen.py, driven in-pod by validation-runner.sh.
This is the same topology described in traces/README.md (the local-sim self-captures
swap the real engine for the sim, no GPU). For conformance goldens we always use the
real engine, because the point is to measure the engine vLLM actually ships for a line.
What pins the vLLM version
The vLLM version under capture is pinned by the engine container image digest, not by
a tag. The per-line engine + tap/frontend images live in models.toml under
[lines.<vllm_tag>], e.g.:
[lines."v0.23.0"]
engine_image = "docker.io/vllm/vllm-openai:v0.23.0@sha256:6d8429e3..."  # release, by digest
tap_image    = "ghcr.io/neuralmagic/vllm-vcr:vllm0.23"     # built for this line
For a conformance capture, pin the engine to the release tag's published image for
the line you are validating (the tag field in compat.toml, e.g. v0.23.0), by its
digest, that digest is the ground truth for "which vLLM this golden measures" (record it
in the manifest entry's provenance). The nightly line instead points at the post-merge
image at its protocol_rev. The tap and frontend stay on the per-line capture image
(vllm-vcr record + vllm-rs), built against that line's protocol_rev so the wire
parses, which is exactly what CI's docker.yml publishes as :vllm<line>.
Capture hygiene
These rules are carried from traces/README.md; they are the difference between a
golden you can gate on and noise:
- One workload per pod lifetime. A half-rewired pod records garbage. Each capture pod runs exactly one workload and is torn down.
- Never fit and gate on the same trace. A trace used to fit the latency model
cannot also be the fidelity gate; that is grading your own homework. Keep fitting
captures and gate captures separate (the manifest
rolefield:schemavsfidelity). - Never trust a single seed. 3 of ~10 multiturn captures turned out anomalous and only multi-seed averaging exposed them. Capture multiple seeds for any gate; a lone capture is an anomaly waiting to happen.
- Fetch promptly. The cluster reaps idle GPU pods (~35 min) and
emptyDirtraces die with the pod. The loadgen container self-terminates after 2h if never fetched, so an abandoned run cannot squat on the GPU.
Stand up a capture per line
Each capture is a Kueue-admitted Job on the GPU cluster (waldorf), so Kueue holds the Job
until GPU quota admits it and releases the GPU the moment the capture completes. The
capture matrix lives in deploy/trace-capture/models.toml: one [[capture]] per
model × scenario (baseline / nocache / specdecode / multimodal), each pinned to a
line's engine + tap/frontend images. gen-capture-jobs.py turns a target into a Job; the
scenario drives the engine and tap flags so the config_hash matches the engine config
(prefix-cache, spec-decode). Generated conformance Jobs enable --record-tokens and
--step-stats-out, so the trace is usable as a fidelity golden and the sidecar stats are
available for timing inspection. To add a model or scenario, edit models.toml, no YAML by
hand.
All capture Jobs target conformance-queue (base/conformance-queue.yaml), a dedicated Kueue
queue with a one-GPU quota, so they run one at a time: submit as many as you like and
they serialize, the rest wait pending (capture hygiene: one workload per pod lifetime, no
cross-capture interference). Each pod runs engine/tap/frontend as sidecars and
validation-runner.sh as the loadgen container, which runs $PHASES, marks the trace
line count at each phase boundary, then idles until the trace is fetched.
The flow (wrapped by the justfile):
just conformance-queue                  # apply the one-GPU queue (once)
just conformance-list                   # see the targets in models.toml
just conformance-capture qwen3-8b       # ship loadgen scripts + submit the Job
just conformance-capture \
  nightly-qwen3-8b-mt-s7 \
  nightly-qwen3-8b-mt-s13 \
  nightly-qwen3-8b-nocache-s7           # rolling vLLM main goldens

# raw equivalent:
python3 deploy/trace-capture/gen-capture-jobs.py qwen3-8b | kubectl apply -f -

# wait for the loadgen to finish (it logs "waiting for fetch"):
kubectl logs -f job/trace-qwen3-8b -c loadgen
To capture a new line (e.g. a new release or nightly), add a [lines.<vllm_tag>] entry
(engine image digest + the tap/frontend image built for that line) and point captures at it.
The built-in nightly set is deliberately small: two multiturn seeds with prefix caching
enabled plus one nocache multiturn capture, all against Qwen3-8B.
Fetch the trace + step stats
Fetch before the reaper window closes. The marker is the loadgen log line "waiting for fetch":
NAMESPACE=${NAMESPACE:-inference-sim}
JOB=trace-nightly-qwen3-8b-mt-s7

# The trace, and the per-step SchedulerStats sidecar if captured.
kubectl exec -n "$NAMESPACE" "job/$JOB" -c loadgen -- cat /trace/trace.jsonl > "$JOB.jsonl"
kubectl exec -n "$NAMESPACE" "job/$JOB" -c loadgen -- cat /trace/step-stats.jsonl > "$JOB.step-stats.jsonl"

# Let the Job complete and release the GPU.
kubectl exec -n "$NAMESPACE" "job/$JOB" -c loadgen -- touch /trace/fetched
Compress before upload (.jsonl.gz); the trace tooling and the sim read gzip
transparently.
Compute the config hash
The config_hash is the profile-once/replay-many cache key. It fingerprints the
capture config (model, GPU, TP, scheduler flags) so a trace cannot be replayed against
a config it was not captured for. The tap stamps it into the trace metadata line via
--config-hash, and the sim asserts it at replay via --expect-config-hash (see
src/record.rs and crates/sim-trace/src/trace.rs).
The recipe is ConfigFingerprint in crates/sim-trace/src/config_hash.rs: a lowercase-hex
SHA-256 over a versioned, order-fixed canonical form (scheme tag config-fingerprint-v3)
of three inputs:
gpu(hardware, e.g.H200)vllm_tag(the line tag, e.g.v0.23.0)engine_config— a canonical, sorted digest of the deployed behavioral engine flags (model, tensor-parallel, gpu-mem-util, max-model-len, max-num-seqs, block-size, enforce-eager, prefix-caching, speculative config, ...), built by the capture driver.
The design rule is hardware + version + deployed behavioral flags, deliberately not
a hand-curated field list (the per-knob trap, you'd forever be adding the next one) and
not the entire resolved config: engine defaults aren't enumerated because vllm_tag
pins them, and transport/addressing flags are excluded. vllm_tag is the line tag, NOT
the engine's raw reported version (a dev build 0.23.0.dev1+g..., not reproducible across
rebuilds); the reported version is recorded separately in the trace meta (vllm_version).
engine_config is what keeps a cache-off, spec-decode, or eager-vs-graph capture from
sharing a fingerprint with another deployment of the same model/hardware. If the input set
ever changes, bump the scheme so old hashes deliberately stop matching. (Older goldens keep
their own scheme's hashes and stay valid: the sim compares the stamped hash, never recomputes.)
Two ways to get the hash:
- Run the tap with
--vllm-version <tag>,--gpu <type>, and--engine-config <canonical>(plus--model/--tp/--block-size/--max-num-seqsfor the readable trace meta) and let it compute the fingerprint, stampingconfig_hashinto the tracemeta. This is the default;gen-capture-jobs.pybuilds the--engine-configstring (it owns the engine flags, the tap can't observe them on the wire), and the manifest entry just copies the hash. - Or pass
--config-hash <hash>explicitly to override the computed value.
Upload + register the golden
Goldens are NOT committed to the repo: they are measurement data, some are large, and
token-recording captures carry model content. They live under the conformance/ prefix
of the bucket CI fetches by sha ($CONFORMANCE_BUCKET, set in
.github/workflows/ci.yml). The GHA runner assumes a least-privilege fetch role over
GitHub OIDC, scoped to s3:GetObject on conformance/* only.
# 1. Upload to the conformance/ prefix (use credentials with write access; the CI
#    role is read-only). $CONFORMANCE_BUCKET is the bucket defined in ci.yml.
# Path convention: conformance/<vllm_tag>/<gpu>/<model>/<workload>[-<seed>].jsonl.gz
# where <vllm_tag> is the release tag (v0.23.0) or "nightly" (tracks main). These
# mirror config_hash inputs (vllm_tag/gpu/model), so captures across builds, hardware,
# and models don't collide.
aws s3 cp trace.jsonl.gz \
  "$CONFORMANCE_BUCKET/conformance/<vllm_tag>/<gpu>/<model>/<workload>-<seed>.jsonl.gz"

# 2. Record the sha256 (the conformance runner verifies it after fetch).
sha256sum trace.jsonl.gz
Add a [[golden]] entry to conformance/manifest.toml:
[[golden]]
line        = "0.23"                                  # matches a compat.toml line
bucket_path = "conformance/v0.23.0/H200/Qwen/Qwen3-8B/multiturn-seed7.jsonl.gz" # key under $CONFORMANCE_BUCKET (or a full s3:// URI)
sha256      = "<sha256 of the uploaded .gz>"          # runner verifies this after fetch
config_hash = "<the trace's config_hash>"             # replay asserts --expect-config-hash
workload    = "multiturn"                              # human-readable workload label
role        = "fidelity"                              # "schema" or "fidelity"
Nightly entries use line = "nightly" and live under the conformance/nightly/...
prefix, for example
conformance/nightly/H200/Qwen/Qwen3-8B/multiturn-seed7.jsonl.gz. Once any nightly
entry lands, the nightly canary detects it and fetches/replays it before refreshing the
rolling prerelease.
The Nightly Golden Capture workflow automates this operator loop. It runs on a
nightly schedule and can also be manually dispatched with an alternate target list.
It authenticates to the conformance cluster with GitHub OIDC, submits the configured
Kueue capture targets, uploads the token-recording traces, and opens or updates a PR
with the generated nightly manifest block. It expects these repository variables:
CONFORMANCE_CLUSTER_URL— Kubernetes API server URL for the capture cluster.CONFORMANCE_CAPTURE_ROLE_ARN— AWS role allowed to writeconformance/*objects.
A line gains has_goldens = true in the CI matrix automatically once it has a
[[golden]] entry; that is what turns on the AWS fetch leg for it (lines without
goldens skip credentials entirely).
role = "schema" captures gate the wire protocol parsing (cheap, never a fidelity
gate); role = "fidelity" captures gate replay accuracy. Per the hygiene rules,
fitting captures and fidelity-gate captures must be different traces, and a fidelity
gate should reference multiple seeds.
Flip the line to validated
A new line lands in compat.toml with fidelity_validated = false. The matrix builds
it and runs conformance, but a fidelity failure does not block promotion
(continue-on-error in the non-gating conformance step, see .github/workflows/ci.yml).
Once the golden(s) are uploaded, registered, and the replay gates green for that line:
- Flip
fidelity_validated = truefor the line incompat.toml. - On the next run the conformance leg for that line becomes a hard gate.
- When the line becomes the head, move
default = trueto it (:latestfollows the default line) and drop the now-N-4 line perversioning.md.
The conformance runner
The runner is the tests/conformance.rs integration test. It is manifest-driven and
runs entirely on CPU, so the CI matrix invokes it per line after building against that
line's protocol_rev:
CONFORMANCE_BUCKET=s3://your-bucket cargo test --test conformance -- --nocapture
For the line this build targets (VLLM_TARGET_VERSION, stamped from compat.toml), it
reads conformance/manifest.toml, and for each [[golden]] on that line fetches the
golden straight from S3 via sim-s3 (a full s3:// bucket_path as-is, else the key
joined under $CONFORMANCE_BUCKET). It then asserts:
- integrity: the fetched bytes hash to the manifest
sha256. - line: the golden's recorded
vllm_versionis on the samemajor.minorline as the build (assert_same_line). - provenance: the trace's
config_hashequals the manifest entry'sconfig_hash. - schema (
role = "schema"): the sim'sSimReadyResponsecarries every field the captured engine emitted (assert_ready_response_schema, decoded from the meta'sready_response_hex). This is the automated, per-line generalization of theblock_sizecanary: a new line that grows a registration field fails here. - fidelity (
role = "fidelity"): boots the sim on the golden under theconfig_hashgate and asserts every recorded token stream replays byte-identically.
It skips cleanly (passes without asserting) when there are no goldens for the line,
which is the normal state until captures exist. Set $CONFORMANCE_MANIFEST to point at
an alternate manifest. The pure assertions live in src/conformance.rs and are
unit-tested independently of any real capture.
The nightly canary is therefore a protocol-drift smoke until nightly captures exist,
not a true fidelity gate: after pinning to live vLLM main, it runs the manifest
runner for schema/provenance plumbing and also runs the HEAD-client protocol e2e
tests (engine_core_e2e and tap_e2e) so a client-wire break still turns the run red.
When a line = "nightly" golden is added, the canary detects it, assumes the same
golden-fetch role as CI, and replays it before publishing the rolling prerelease.
The GPU-free replay half
The replay-many half needs no GPU anywhere. deploy/trace-capture/base/offline-replay.yaml
runs the same python frontend with vllm-vcr play (not a real engine) in the engine
slot, serving a captured trace with content-keyed matching:
The frontend MUST run the same model/tokenizer as the capture (prefix matching is on
token ids), and stays on the protocol-pin image for the line. This is the same
mechanism CI's conformance step uses headlessly: fetch the golden by sha, then replay
it against the sim built for that line and assert --expect-config-hash.
Building the capture image on waldorf
The tap + frontend capture image is linux/amd64; cross-building it on Apple Silicon
under QEMU is unreliable (rustc SIGSEGVs under emulation). Build natively:
just image-build && just image-pushbuilds and pushes thelinux/amd64image for the compat.toml default line (slow under emulation; run on an amd64 host).just image-build-line <line>builds the image for an older line, e.g.just image-build-line 0.22: it pinsCargo.tomlto that line's rev/fork withcargo xtask pin-vllm, stampsVLLM_TARGET_VERSION, and builds the vllm-rs frontend from the same source as the tap. (It leavesCargo.toml/Cargo.lockrewritten; restore those files after the build if you do not want to keep the local pin.)- On Apple Silicon, use the build-on-waldorf flow to build natively on the cluster with an unprivileged kaniko pod instead of cross-building locally.
CI publishes these per line automatically (.github/workflows/docker.yml): the same
pin step, VLLM_TARGET_VERSION, and frontend-source wiring run per matrix leg, so the
floating vllm<line> image is built against that line's wire. Build locally only when
you need an image ahead of a CI publish.
Closed-loop agentic replay: SWE-bench offline
Goal: capture one real SWE-bench agent rollout against a live vLLM, then re-run the same agent fully offline against the sim and get the same patches, the same eval results, zero GPU, zero API spend.
The repo side is done: --replay-tokens <trace> --replay-match prefix turns
the sim into a content-keyed cassette player. See
Content-identical replay for the replay mode;
this page is the runbook for the SWE-bench demo around it.
Why this works
SWE-bench splits into rollout (the agent loop, the only LLM-dependent phase)
and evaluation (swebench.harness.run_evaluation, which applies patches in
per-instance Docker images and runs tests, no model calls). So only the
rollout needs capture/replay.
The agent's message history is append-only: turn N+1's prompt = turn N's
prompt + turn N's response + new tool output. Replay serves turn N's response
byte-identically, so a deterministic agent reconstructs turn N+1's prompt
exactly as captured, and the loop closes. Prefix matching keys on the chained
block hashes the tap already records; tail noise in tool output (timing
strings like pytest's in 0.42s) only shortens the match depth, it cannot
change which record wins.
Agent harness choice
What decides replayability: volatile content must not appear early in the prompt (chained block hashes make an early difference fatal), and history must be append-only (compaction rewrites the prefix mid-session). One hazard is universal: a harness that stamps today's date into the system prompt breaks matching when the replay happens on a different day; pin the clock in the rollout container with libfaketime to the capture date.
- mini-swe-agent
(
mini-extra swebench), the v1 and determinism control: strictly linear append-only history, deterministic truncation (pure char-count slicing at 10k chars), no timestamps/hostnames in the default swebench templates, talks OpenAI chat completions via LiteLLM so it works against the vllm-rs frontend as-is, and writespreds.jsondirectly consumable by the official eval harness. - pi, the "real agent" driver:
native tool calling, append-only history, no compaction, and its only
volatile prompt content is a day-precision date + cwd (cwd is constant
inside a SWE-bench container, the date is faketime's job). Point
models.ymlat the frontend (api: openai-completions,baseUrl), settemperature: 0, run headless per instance,git difffor the patch (model the glue on badlogic/pi-terminal-bench). - Claude Code, the headline demo: set
CLAUDE_CODE_ATTRIBUTION_HEADER=0to disable the attestation line it otherwise prepends to the system prompt (x-anthropic-billing-header: ..., per-conversation hash; vLLM > 0.17.1 also strips it server-side). Its gitStatus snapshot is reproducible when replay starts from the same SWE-bench image; the date needs faketime. The remaining work is plumbing: it speaks the Anthropic/v1/messagesAPI, so capture needs either the native vLLM frontend (>= 0.11.2) or a LiteLLM translation proxy in front of the Rust one.
Avoid opencode for this: it puts a live git-status block early in the system prompt (changes as the agent edits files, poisoning the prefix on most steps) and auto-compacts history by default. Codex CLI can't target vLLM at all (Responses-API-only wire protocol).
Capture (one GPU run)
Standard tap sidecar setup (manifests in deploy/trace-capture/), with token
recording on and the python vLLM frontend, which serves /v1/messages
for Claude Code (vllm-rs doesn't yet; the protocol-pin image c9340e6f3
already ships the anthropic entrypoint including the billing-header strip):
-
just agentic-capture-updeploysdeploy/trace-capture/base/h200-capture-agentic.yaml(tap has--record-tokenson; the trace carries user content, token ids decode back to text, treat it accordingly). First deploy: verify the API-only frontend boots without a GPU; vLLM's platform probe has historically wanted CUDA, and the fallback is a CPU-target build of the same commit. -
Point mini-swe-agent at the frontend and run a few instances:
mini-extra swebench --subset verified --split test --slice 0:5 \
  --model hosted_vllm/Qwen/Qwen3-8B --workers 1
# model base URL via the usual LiteLLM env (HOSTED_VLLM_API_BASE=http://<frontend>:8000/v1)
--workers 1for the first capture: concurrent instances interleave fine (prompts don't share prefixes across instances past the system prompt), but single-stream makes the trace easy to eyeball. -
Keep the agent's sampling deterministic-ish (
temperature: 0in the model kwargs). Not strictly required for replay (the recorded tokens are served regardless of what sampling the replayed client asks for), but it makes capture-vs-replay diffs meaningful. -
Save
preds.jsonfrom the capture run; it's the ground truth the replay must reproduce.
Replay (no GPU)
On the cluster: just replay-up deploys
deploy/trace-capture/base/offline-replay.yaml (the same python frontend in
front of vllm-vcr play --replay-match prefix, zero GPU), then
just replay-load-trace <trace> copies the capture in; the sim starts as
soon as the file appears. Or run the same pair locally:
vllm-vcr play --handshake-address tcp://127.0.0.1:5570 \
  --replay-tokens swebench-capture.jsonl.gz --replay-match prefix \
  --latency-trace swebench-capture.jsonl.gz   # optional: replay timing too
Same tokenizer is load-bearing: matching happens on token ids, so the frontend must run the same model name and tokenize identical text to identical ids (keep both rigs on the protocol-pin image).
WARNING: keep --latency-trace on when replaying tool-calling models
through the python frontend. Unpaced replay delivers entire responses
faster than the frontend's streaming consumer drains them; the per-request
RequestOutputCollector then merges deltas, and vLLM's qwen3_coder
streaming tool parser corrupts (>= ~8 tokens/delta) or silently drops
(whole response in one delta) tool calls, which kills the agent loop after
one turn. Paced replay reproduces the captured ~1 token/delta layout and
sidesteps the bug (upstream: vllm#45256; local repros in
demo/repro-qwen3coder-burst.py and demo/bench-parser-quadratic.py; the
parser's full-text rescans are also O(n^2) in response length). The Rust
frontend's tool parsers are delta-layout invariant and don't need this.
Then re-run the exact same agent command against it and compare:
preds.json (replay) == preds.json (capture), then run the official eval
on the replayed predictions:
python -m swebench.harness.run_evaluation \
  --predictions_path preds.json --run_id offline-replay ...
Watch the sim logs: every "no trace record shares a prompt prefix" or "prompt shorter than one block" warning is a request that fell back to random tokens, i.e. a divergence to explain (usually nondeterministic tool output deep enough in the prompt to flip an entire turn, or a tokenizer mismatch).
Known hazards
- Tool-output nondeterminism inside the SWE-bench containers (timestamps,
partial output on command timeouts, unsorted
find/ls). Tail noise is absorbed by longest-prefix matching; noise early in a turn's tool output shifts every later block and degrades the match to the turns before it. - Aborted requests are dropped by the tap, so a client-side timeout during capture leaves a hole in the trace and the replayed agent gets random tokens for that turn.
- Concurrent identical prompts (agent retries) consume duplicate records in arrival order; once records run dry, retries re-serve the best match.
Dependencies of note
The dependency graph is intentionally split so offline trace tooling stays light while protocol-facing binaries remain pinned to the vLLM line they speak.
vllm-engine-core-clientis a pinned git dependency onvllm-project/vllm(revinCargo.toml). The supported-line matrix rewrites this rev fromcompat.toml; do not let routine dependency tooling bump it.nixl-sysis a pinned git dependency onai-dynamo/nixl, matching the source used when the image buildslibnixl. The default build does not compile it; enablenixlfor real transfers ornixl-stubfor typechecking without libnixl.sim-traceis deliberately vLLM-protocol-free. It owns the trace schema, calibration models, Perfetto conversion, and guidellm conversion so analysis tools can build without compiling the protocol stack.